Scatterplots Digital Activity for Google Slides/Pear Deck
- PDF
- Google Apps™
- Internet Activities

Also included in
- This bundle includes all the 8th grade math digital activities for Google Slides with Pear Deck add-on. Works great with in-person or distance learning. Watch students work in real time and share answers with the class without showing names.All slides are completely editable - you can even add youPrice $45.00Original Price $74.00Save $29.00
Description
This product includes a digital Google Slides presentation with a PearDeck add-on. Works great with in-person or distance learning. Watch students work in real time and share answers with the class without showing names. The slides can be used alone for a class presentation but are meant to be used with the Pear Deck add-on. Simply open the slides, make a copy, go to Add-ons → Pear Deck and then click the green “start lesson” button on the right hand side where the Pear Deck options pop up. Using a free Pear Deck account to present this to your class either in person, remotely, or hybrid allows for student engagement and immediate feedback for you. Students can use any device (phone, tablet, laptop, computer) to draw or type their responses which you can see instantly on your computer. You can share anonymous student work for the class to analyze. This is a great way to see if your students are understanding, especially when teaching remotely.
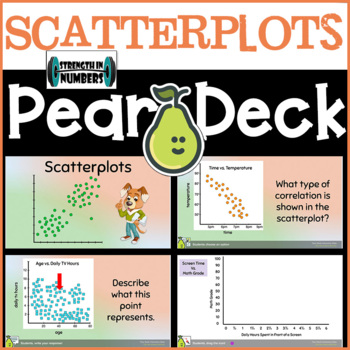
Included are 16 slides that cover scatter plots. The slides will walk students through the definition of positive, negative and no correlations. Students will draw conclusions from scatterplots and combine their own data with everyone in the class to make an instant scatterplot to evaluate. (the whole-class scatterplot can only be done when doing a live pear deck presentation) They will also be asked to sketch a scatterplot that could result from given variables. Questions are a mixture of multiple choice and free response and are completely editable. You can add more problems or take some out. You can even make the Bitmoji your own. :)


