TPT
Total:
$0.00

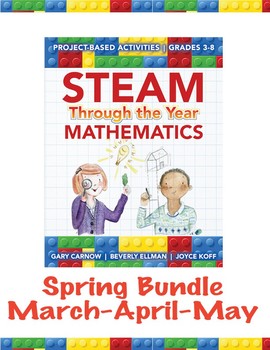
STEAM Through the Year: Mathematics – Spring Bundle (March, April and May)

Rated 5 out of 5, based on 1 reviews
5.0 (1 rating)
;
Inventive Thinkers
84 Followers
Grade Levels
1st - 6th, Homeschool, Not Grade Specific
Standards
Formats Included
  • PDF
Pages
89 pages
$25.95
$25.95
Share this resource
Report this resource to TPT
Inventive Thinkers
84 Followers

Description

Special bundle pricing, each unit is priced at $4.95 each when purchased separately, $12.95 for the bundle. Buy the bundle for a sweet spring deal and save over 12%! STEAM Through the Year: Mathematics Spring Bundle for March, April and May guides you through three months of STEAM lessons and projects. Students build mathematical proficiency with monthly-thematic lessons correlated to the National Council of Teachers of Mathematics standards. Here you will find easy-to-use lessons providing practical strategies and problem-solving activities. The math and poetry lessons are themed around special days and holidays. For March explore – Women’s History Month, Music in the Schools Month, St. Patrick’s Day and Suddenly It’s Spring; for April – Children and Nature Awareness Month, National Poetry Month, Math Awareness Month and Earth Day; and for May – Wildflower Month, May Day, Mother’s Day and Memorial Day.

Students gain access to the work of great poets by understanding and recognizing poetic forms. Need a creative STEAM math lesson idea? Simply turn to one of the selected days and you’re off and running. The math and poetry lessons are classroom-tested and provide enjoyable learning experiences in a variety of environments: traditional classrooms, home schooling, after-school programs, and gifted and talented programs. The resources and learning approaches are especially suited for gifted learners as they are inquiry-based and provide discovery learning opportunities with lots of higher-level questions. The activities also encourage student choice for independent or group work.

Total Pages
89 pages
Answer Key
N/A
Teaching Duration
N/A
Report this resource to TPT
Reported resources will be reviewed by our team. Report this resource to let us know if this resource violates TPT’s content guidelines.

Standards

to see state-specific standards (only available in the US).
Draw a scaled picture graph and a scaled bar graph to represent a data set with several categories. Solve one- and two-step “how many more” and “how many less” problems using information presented in scaled bar graphs. For example, draw a bar graph in which each square in the bar graph might represent 5 pets.
Generate measurement data by measuring lengths using rulers marked with halves and fourths of an inch. Show the data by making a line plot, where the horizontal scale is marked off in appropriate units-whole numbers, halves, or quarters.
Solve real world and mathematical problems involving perimeters of polygons, including finding the perimeter given the side lengths, finding an unknown side length, and exhibiting rectangles with the same perimeter and different areas or with the same area and different perimeters.
Use the four operations to solve word problems involving distances, intervals of time, liquid volumes, masses of objects, and money, including problems involving simple fractions or decimals, and problems that require expressing measurements given in a larger unit in terms of a smaller unit. Represent measurement quantities using diagrams such as number line diagrams that feature a measurement scale.
Use place value understanding to round whole numbers to the nearest 10 or 100.

Reviews

Questions & Answers

84 Followers