TPT
Total:
$0.00

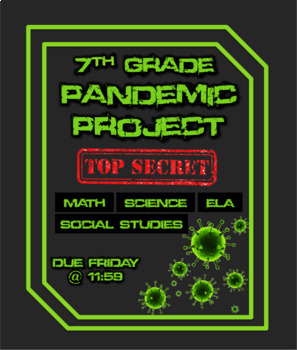
Pandemic Cross-Curricular Project (Coronavirus Distance Learning)

Rated 4.78 out of 5, based on 9 reviews
4.8Ā (9 ratings)
;
Grade Levels
5th - 9th, Homeschool
Standards
Formats Included
  • Google Driveā„¢ folder
Pages
16 pages
$15.00
$15.00
Share this resource
Report this resource to TPT
Made for Google Driveā„¢
This resource can be used by students on Google Drive or Google Classroom. To access this resource, youā€™ll need to allow TPT to add it to your Google Drive. See ourĀ FAQĀ andĀ Privacy PolicyĀ for more information.

Description

Items included in this resource (PDF and Editable):

-Project Title Page

-Table of Contents

-PBL Letter from the CDC

-Generic Overview of Project

-Math Assignment (Crossed with Science)

-Science Assignment (Crossed with Math, Social Studies, and ELA)

-Social Studies Assignment (Cross with Math, Science, and ELA)

-ELA (Crossed with Science and Social Studies)

-Due Date Table (Rough and Final Drafts)

-Help Session Table (Math, Science, Social Studies, ELA)

-Rubrics (Math, Science, Social Studies, ELA)

-Resource Websites

-Individual Due Date Slides for EACH content area (Editable and PDF)

This project has been designed for digital completion. It is a cross-curricular unit, focused on teaching and researching Pandemics. The focus is on the history of Pandemics, Coronavirus, personal reflection, as well future Pandemic planning. Students will complete multiple different assignments for their content teachers. For the Math project, the focus is on creating graphs and tables with Coronavirus case numbers around the world and in their particular state. From those tables, they will write a brief reflection and analysis of that data. The Science portion has students researching the history of Pandemics, a past Pandemic, Coronavirus, and creating and hypothesizing solutions for the virus. Social Studies will be tied into this portion of the project for fact-checking and research strategies. The Social Studies and ELA portion of the project is creating a Newspaper on the Pandemics, Coronavirus, and their personal experiences throughout this Pandemic. The research from their Math and Science portions of the project will assist them in the writing of these articles. They will be graded on their research, critical thinking, and writing skills for this portion. Rubrics have been included for each assignment. Generic resources and websites have also been include, at the end of the project, to assist throughout the project. This could easily be uploaded to Google Classroom or split across a team, during digital learning! It could also be used for a distance learning, group project!

Note: For the Newspaper Article, I used the template offered on TPT by Circle Time with Ms. Fox. I edited it to fit this particular project, but it saved me time from having to do it myself.

Link to her Newspaper template: https://www.teacherspayteachers.com/Product/EDITABLE-Newspaper-Template-Google-Docs-Microsoft-Word-5-pages-5088356

Total Pages
16 pages
Answer Key
N/A
Teaching Duration
1 Week
Last updated Mar 31st, 2020
Report this resource to TPT
Reported resources will be reviewed by our team. Report this resource to let us know if this resource violates TPTā€™s content guidelines.

Standards

to see state-specific standards (only available in the US).
Understand that statistics can be used to gain information about a population by examining a sample of the population; generalizations about a population from a sample are valid only if the sample is representative of that population. Understand that random sampling tends to produce representative samples and support valid inferences.
Use data from a random sample to draw inferences about a population with an unknown characteristic of interest. Generate multiple samples (or simulated samples) of the same size to gauge the variation in estimates or predictions. For example, estimate the mean word length in a book by randomly sampling words from the book; predict the winner of a school election based on randomly sampled survey data. Gauge how far off the estimate or prediction might be.
Informally assess the degree of visual overlap of two numerical data distributions with similar variabilities, measuring the difference between the centers by expressing it as a multiple of a measure of variability. For example, the mean height of players on the basketball team is 10 cm greater than the mean height of players on the soccer team, about twice the variability (mean absolute deviation) on either team; on a dot plot, the separation between the two distributions of heights is noticeable.
Use measures of center and measures of variability for numerical data from random samples to draw informal comparative inferences about two populations. For example, decide whether the words in a chapter of a seventh-grade science book are generally longer than the words in a chapter of a fourth-grade science book.
Write informative/explanatory texts, including the narration of historical events, scientific procedures/experiments, or technical processes.

Reviews

Questions & Answers