Oceanography -Ocean science salinity and latitude
The Lesson Pony
108 Followers
Grade Levels
6th - 8th
Subjects
Standards
NGSSMS-ESS3-2
NGSSMS-ESS3-5
NGSSMS-ESS3-4
NGSSMS-ESS3-3
Formats Included
- PDF
- Webquests
Pages
4 pages
The Lesson Pony
108 Followers
Compatible with Digital Devices
The Teacher-Author has indicated that this resource can be used for device-based learning.
What educators are saying
This resource was helpful in leading and teaching my students about the effects of salinity and latitude! Thank you!
Also included in
- This Marine Science Bundle is meticulously curated to cater to your teaching needs, particularly if you are new to instructing Marine Science and seeking a comprehensive starting point. The bundle encompasses many resources tailored to Earth Science educators, guiding students to explore the signifPrice $56.19Original Price $80.27Save $24.08
Description
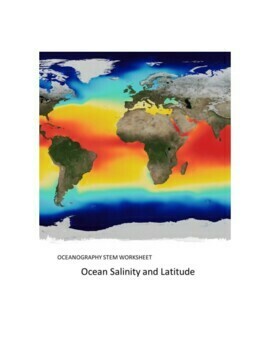
This web quest (STEM) and graphing worksheet is designed to teach middle school science students about the relationship of the salinity and latitude of the world's ocean waters.
It includes great websites, a graphing exercise, and an open-response question. This web quest will encourage students to engage in argumentative discussion by looking at real data to discuss climate change with supporting evidence
Materials
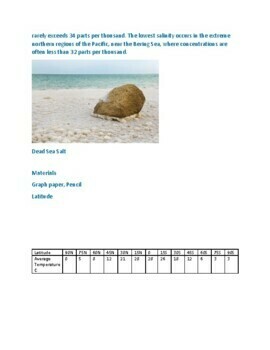
Materials Graph paper, Pencil Latitude
Total Pages
4 pages
Answer Key
N/A
Teaching Duration
45 minutes
Report this resource to TPT
Reported resources will be reviewed by our team. Report this resource to let us know if this resource violates TPT’s content guidelines.
Standards
to see state-specific standards (only available in the US).
NGSSMS-ESS3-2
Analyze and interpret data on natural hazards to forecast future catastrophic events and inform the development of technologies to mitigate their effects. Emphasis is on how some natural hazards, such as volcanic eruptions and severe weather, are preceded by phenomena that allow for reliable predictions, but others, such as earthquakes, occur suddenly and with no notice, and thus are not yet predictable. Examples of natural hazards can be taken from interior processes (such as earthquakes and volcanic eruptions), surface processes (such as mass wasting and tsunamis), or severe weather events (such as hurricanes, tornadoes, and floods). Examples of data can include the locations, magnitudes, and frequencies of the natural hazards. Examples of technologies can be global (such as satellite systems to monitor hurricanes or forest fires) or local (such as building basements in tornado-prone regions or reservoirs to mitigate droughts).
NGSSMS-ESS3-5
Ask questions to clarify evidence of the factors that have caused the rise in global temperatures over the past century. Examples of factors include human activities (such as fossil fuel combustion, cement production, and agricultural activity) and natural processes (such as changes in incoming solar radiation or volcanic activity). Examples of evidence can include tables, graphs, and maps of global and regional temperatures, atmospheric levels of gases such as carbon dioxide and methane, and the rates of human activities. Emphasis is on the major role that human activities play in causing the rise in global temperatures.
NGSSMS-ESS3-4
Construct an argument supported by evidence for how increases in human population and per-capita consumption of natural resources impact Earth’s systems. Examples of evidence include grade-appropriate databases on human populations and the rates of consumption of food and natural resources (such as freshwater, mineral, and energy). Examples of impacts can include changes to the appearance, composition, and structure of Earth’s systems as well as the rates at which they change. The consequences of increases in human populations and consumption of natural resources are described by science, but science does not make the decisions for the actions society takes.
NGSSMS-ESS3-3
Apply scientific principles to design a method for monitoring and minimizing a human impact on the environment. Examples of the design process include examining human environmental impacts, assessing the kinds of solutions that are feasible, and designing and evaluating solutions that could reduce that impact. Examples of human impacts can include water usage (such as the withdrawal of water from streams and aquifers or the construction of dams and levees), land usage (such as urban development, agriculture, or the removal of wetlands), and pollution (such as of the air, water, or land).


