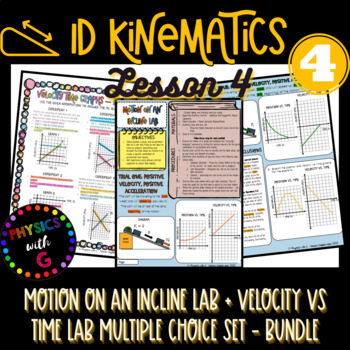
Motion on an Incline Lab + Velocity vs Time Lab MC: Lesson 4 Kinematics in 1D
- Zip
Products in this Bundle (2)
Bonus
Also included in
- This massive resource has over 656 pages of lesson plans, unit plans, student worksheets, student labs, PowerPoint notes, PowerPoint review games, practice sets, activities, assessments, answer keys, and more! Purchasing the unit bundle saves you 20%, which works out to only $0.12 per page! IncludedPrice $72.70Original Price $90.87Save $18.17
Description
This resource includes the Motion on an Incline Lab + the Lab-Based Velocity vs. Time Multiple choice set. In addition to those resources, a Bonus File is included with this resource. The bonus file includes:
- Unit plan for 1D kinematics
- NGSS and CC aligned lesson plan for Lesson 4 in the unit plan.
- All student pages are connected in order
- Graphical Analysis and LoggerPro instructions for the lab. - 2 versions of student pages.
- All Answer key/teacher pages are connected in order
- All Teacher Guide and instructional pages are connected in order
- Instructions for printing pages and keys
Motion on an Incline Lab:
What is required to complete this lab?
- Teachers will need to have access to dynamics tracks and carts lab equipment. Companies like Vernier and Pasco both carry similar versions of this along with some other smaller companies - the instructions are written generically for teachers so it will apply to any company that stocks this kind of equipment.
- There are versions of the labs for both Logger Pro and the Graphical Analysis (Chromebook) app/website.
- Student computers/devices to connect with the software - this comes with the purchase of the lab equipment from the company.
What is included in this Lab Resource?
- Copy of the black and white student lab pages (3 pages)
- Full-color copy of the lab answer key for teachers with sample data (3 pages)
- Teacher Lab guide with sample data, graphs created from the software, and detailed instructions on how to set up and conduct the experiment with students. ( 8 pages)
- Pictures of the lab setup and sample data sets.
- Differentiability options for all levels of students.
Velocity vs. Time Graphs - Lab-Based Multiple Choice Set:
What is a Lab-Based Multiple Choice Set?
Students are given a description of a lab setup, data/graphs collected during the lab, and a set of multiple-choice questions. Based on the information provided they will answer questions about the lab. These sets are intended to help strengthen understanding between the concepts learned in the notes and the lab content application. Students will consider how concepts are applied to real-world data. This is excellent practice to add in as a warmup, practice set, review set, or even as a mini quiz!
Content and skills Covered:
- Velocity vs. Time graphs
- Slope, slope direction/sign, slope steepness
- Units on graphs
- Motion detectors and direction
- laboratory skills
- reading motion graphs
9/22/23 Edit - included Graphical Analysis instruction sets and fixed a typ on one of the pages.


