Mini Project: Proportional Relationships through Salaries
SkewLines
226 Followers
Grade Levels
7th - 8th
Subjects
Standards
CCSS7.EE.B.4
CCSS8.EE.B.5
CCSS7.RP.A.1
CCSS7.RP.A.2
CCSS7.RP.A.2c
Formats Included
- PDF
Pages
2 pages
SkewLines
226 Followers
What educators are saying
This was such a fun project for my students to work on. It was a nice break from book work, which often, if not always fails to explain the real world connection to math. This actually tied in nicely because we worked on this during my school's career month.
Used a cumulative review of proportional relationships. The students enjoyed the real life application!
Also included in
- These Function products (mainly y = mx + b) will last you many days! There are multitude of resources that can be used flexibly to meet the needs of your students. Products include lessons, reference sheets, differentiated stations, scavenger hunts, self-guided worksheets, and culturally-responsivePrice $47.08Original Price $66.25Save $19.17
Description
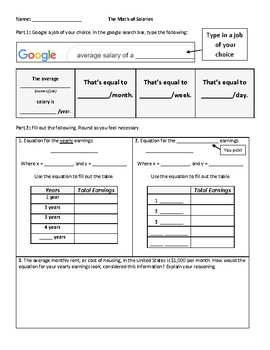
This is a project intended to increase students' intuitive understanding of proportional relationships. Students are invested as they research different jobs and use those jobs to create equations, tables, and graphs of salaries over time. Students will need internet access.
I have used this as an in-class project, as substitute work, as well as homework. Enjoy!
Total Pages
2 pages
Answer Key
Not Included
Teaching Duration
30 minutes
Report this resource to TPT
Reported resources will be reviewed by our team. Report this resource to let us know if this resource violates TPT’s content guidelines.
Standards
to see state-specific standards (only available in the US).
CCSS7.EE.B.4
Use variables to represent quantities in a real-world or mathematical problem, and construct simple equations and inequalities to solve problems by reasoning about the quantities.
CCSS8.EE.B.5
Graph proportional relationships, interpreting the unit rate as the slope of the graph. Compare two different proportional relationships represented in different ways. For example, compare a distance-time graph to a distance-time equation to determine which of two moving objects has greater speed.
CCSS7.RP.A.1
Compute unit rates associated with ratios of fractions, including ratios of lengths, areas and other quantities measured in like or different units. For example, if a person walks 1/2 mile in each 1/4 hour, compute the unit rate as the complex fraction ½/¼ miles per hour, equivalently 2 miles per hour.
CCSS7.RP.A.2
Recognize and represent proportional relationships between quantities.
CCSS7.RP.A.2c
Represent proportional relationships by equations. For example, if total cost 𝘵 is proportional to the number 𝘯 of items purchased at a constant price 𝘱, the relationship between the total cost and the number of items can be expressed as 𝘵 = 𝘱𝘯.


