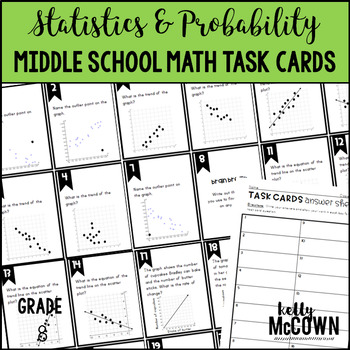
Middle School Math Task Cards: Statistics & Probability {Grade 8: Set 8}
Teaching Math and More
4.8k Followers
Grade Levels
8th, Homeschool
Subjects
Resource Type
Standards
CCSS8.SP.A.1
CCSS8.SP.A.2
CCSS8.SP.A.3
CCSS8.SP.A.4
Formats Included
- PDF
Pages
24 pages
Teaching Math and More
4.8k Followers
What educators are saying
Great engaging and easy to follow and use!! The students had a much better understanding of the concept after the resource was used.
Also included in
- This Middle School Math Task Cards Bundle is a COMPLETED Bundle! All Common Core Standards are addressed with ALL 8 Sets of Task Cards! This Bundle is 20% OFF the original price of all total math task card sets. Included are the following Math Task Cards: 1. Middle School Math Task Cards: ExpPrice $32.00Original Price $40.00Save $8.00
Description
These Middle School Math task cards are for students to be able to construct and interpret scatter plots for bivariate measurement data to investigate patterns of association between two quantities, describe patterns such as clustering, outliers, positive or negative association, linear association, and nonlinear association, know that straight lines are widely used to model relationships between two quantitative variables, use the equation of a linear model to solve problems in the context of bivariate measurement data, interpreting the slope and intercept, and understand that patterns of association can also be seen in bivariate categorical data by displaying frequencies and relative frequencies in a two-way table.Included are:
-32 Task Cards centered on Math curriculum for 8th Grade
-Teacher facilitated activity for 45-60 minutes of classroom time each
-PRINT & GO answer sheets and task cards that are ready with NO PREP
-Directions for using Math Task Cards in your classroom
-Includes 4 brain break cards
***Updated 5/17/17***
***************************************************************************
Other Math Task Card Sets:
8th Grade: Middle School Math Task Cards: Grade 8 BUNDLE
Middle School Math Task Cards: Expressions & Equations {Grade 8: Set 1}
Middle School Math Task Cards: Expressions & Equations {Grade 8: Set 2}
Middle School Math Task Cards: The Number System {Grade 8: Set 3}
Middle School Math Task Cards: Functions {Grade 8: Set 4}
Middle School Math Task Cards: Functions {Grade 8: Set 5}
Middle School Math Task Cards: Geometry {Grade 8: Set 6}
Middle School Math Task Cards: Geometry {Grade 8: Set 7}
***************************************************************************
LEAVE FEEDBACK on this product and earn 5 TPT credits to use on future purchases!
FOLLOW ME to get new product notifications, SALE notices, and freebies!
This purchase is for ONE teacher ONLY. Additional teachers must purchase their own license. You may not upload this resource to the internet in any form. If you are a coach, principal or district interested in purchasing several licenses, please contact me for a district-wide quote at kellymccowntpt@hotmail.com
For more teaching ideas visit www.kellymccown.com.
Total Pages
24 pages
Answer Key
Included
Teaching Duration
90 minutes
Last updated May 17th, 2017
Report this resource to TPT
Reported resources will be reviewed by our team. Report this resource to let us know if this resource violates TPT’s content guidelines.
Standards
to see state-specific standards (only available in the US).
CCSS8.SP.A.1
Construct and interpret scatter plots for bivariate measurement data to investigate patterns of association between two quantities. Describe patterns such as clustering, outliers, positive or negative association, linear association, and nonlinear association.
CCSS8.SP.A.2
Know that straight lines are widely used to model relationships between two quantitative variables. For scatter plots that suggest a linear association, informally fit a straight line, and informally assess the model fit by judging the closeness of the data points to the line.
CCSS8.SP.A.3
Use the equation of a linear model to solve problems in the context of bivariate measurement data, interpreting the slope and intercept. For example, in a linear model for a biology experiment, interpret a slope of 1.5 cm/hr as meaning that an additional hour of sunlight each day is associated with an additional 1.5 cm in mature plant height.
CCSS8.SP.A.4
Understand that patterns of association can also be seen in bivariate categorical data by displaying frequencies and relative frequencies in a two-way table. Construct and interpret a two-way table summarizing data on two categorical variables collected from the same subjects. Use relative frequencies calculated for rows or columns to describe possible association between the two variables. For example, collect data from students in your class on whether or not they have a curfew on school nights and whether or not they have assigned chores at home. Is there evidence that those who have a curfew also tend to have chores?


