Middle School Fitness Testing
Jessica Johnson
3 Followers
Grade Levels
6th - 8th, Homeschool
Subjects
Resource Type
Standards
CCSS6.SP.A.1
CCSS6.SP.A.2
CCSS6.SP.A.3
CCSS7.SP.B.3
CCSS8.SP.A.1
Formats Included
- Word Document File
Jessica Johnson
3 Followers
Description
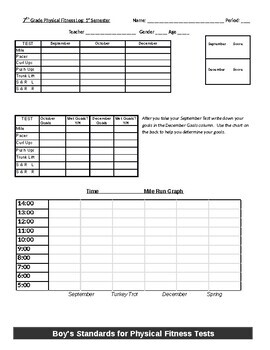
Include grade level logs with current state standards.
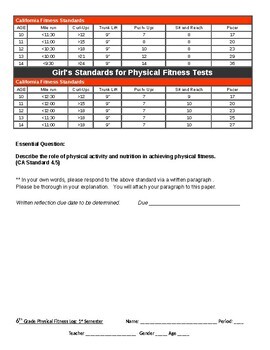
Fitness improvement Rubrics based on age and gender aligned with healthy fitness zones.
Log sheets for teachers.
Total Pages
Answer Key
N/A
Teaching Duration
1 Semester
Report this resource to TPT
Reported resources will be reviewed by our team. Report this resource to let us know if this resource violates TPT’s content guidelines.
Standards
to see state-specific standards (only available in the US).
CCSS6.SP.A.1
Recognize a statistical question as one that anticipates variability in the data related to the question and accounts for it in the answers. For example, “How old am I?” is not a statistical question, but “How old are the students in my school?” is a statistical question because one anticipates variability in students’ ages.
CCSS6.SP.A.2
Understand that a set of data collected to answer a statistical question has a distribution which can be described by its center, spread, and overall shape.
CCSS6.SP.A.3
Recognize that a measure of center for a numerical data set summarizes all of its values with a single number, while a measure of variation describes how its values vary with a single number.
CCSS7.SP.B.3
Informally assess the degree of visual overlap of two numerical data distributions with similar variabilities, measuring the difference between the centers by expressing it as a multiple of a measure of variability. For example, the mean height of players on the basketball team is 10 cm greater than the mean height of players on the soccer team, about twice the variability (mean absolute deviation) on either team; on a dot plot, the separation between the two distributions of heights is noticeable.
CCSS8.SP.A.1
Construct and interpret scatter plots for bivariate measurement data to investigate patterns of association between two quantities. Describe patterns such as clustering, outliers, positive or negative association, linear association, and nonlinear association.


