TPT
Total:
$0.00

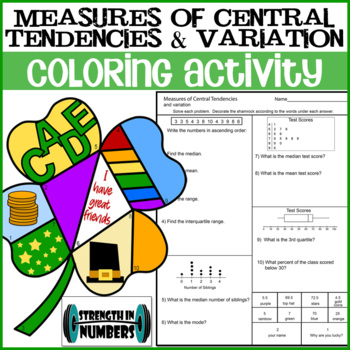
Measures of Central Tendencies & Variation St. Patrick's Day Coloring Activity

Rated 5 out of 5, based on 1 reviews
5.0 (1 rating)
;
Strength in Numbers
945 Followers
Grade Levels
5th - 8th
Resource Type
Standards
Formats Included
  • PDF
Pages
4 pages
$3.00
$3.00
Share this resource
Report this resource to TPT
Strength in Numbers
945 Followers

Description

Students will answer 10 data questions including mean, median, mode, range, quartiles, and interquartile range using lists, dot plots, box plots, and stem-and-leaf plots. This worksheet is self checking - answers are at the bottom and students will use the description under the answer to decorate the shamrock. All my favorite things - colorful, self-checking, and wall-worthy! These are fantastic hung around the classroom for St. Patrick's Day/March because they aren't all exactly the same. Students have the opportunity to personalize their shamrock by adding their name and their why they are lucky (not as easy as you might think).

Get this activity in a Valentine's Day theme here.

Get this activity in an Easter theme here.

Don't forget to earn TPT credits towards FREE products when you leave feedback! :)

This resource is not designed to work with Easel.

Follow me on Instagram!

Total Pages
4 pages
Answer Key
Included
Teaching Duration
45 minutes
Last updated Mar 5th, 2022
Report this resource to TPT
Reported resources will be reviewed by our team. Report this resource to let us know if this resource violates TPT’s content guidelines.

Standards

to see state-specific standards (only available in the US).
Use measures of center and measures of variability for numerical data from random samples to draw informal comparative inferences about two populations. For example, decide whether the words in a chapter of a seventh-grade science book are generally longer than the words in a chapter of a fourth-grade science book.

Reviews

Questions & Answers

945 Followers