Mean Absolute Deviation (MAD) Notes
Math Avengers
25 Followers
Grade Levels
6th - 12th, Higher Education, Adult Education, Homeschool
Subjects
Resource Type
Standards
CCSS7.SP.A.1
CCSS7.SP.A.2
CCSSHSS-ID.A.2
Formats Included
- PDF
Pages
2 pages
Math Avengers
25 Followers
Description
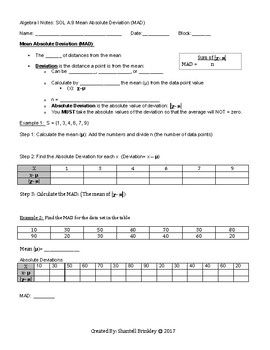
This 1 page cloze note sheet will guide students through understanding what the Mean Absolute Value is. Students will also have the opportunity to calculate the Mean Absolute Deviation for 2 sets of data points by hand. An answer key is also provided.
You are purchasing access for 1 teacher as a classroom set. The document is not to me shared with others or posted on any online venue at any time. For multiple teachers in a school please purchase the number of licenses required for a discounted price. (1 license per teacher). For district use, please contact the seller.
You are purchasing access for 1 teacher as a classroom set. The document is not to me shared with others or posted on any online venue at any time. For multiple teachers in a school please purchase the number of licenses required for a discounted price. (1 license per teacher). For district use, please contact the seller.
Total Pages
2 pages
Answer Key
Included
Teaching Duration
N/A
Report this resource to TPT
Reported resources will be reviewed by our team. Report this resource to let us know if this resource violates TPT’s content guidelines.
Standards
to see state-specific standards (only available in the US).
CCSS7.SP.A.1
Understand that statistics can be used to gain information about a population by examining a sample of the population; generalizations about a population from a sample are valid only if the sample is representative of that population. Understand that random sampling tends to produce representative samples and support valid inferences.
CCSS7.SP.A.2
Use data from a random sample to draw inferences about a population with an unknown characteristic of interest. Generate multiple samples (or simulated samples) of the same size to gauge the variation in estimates or predictions. For example, estimate the mean word length in a book by randomly sampling words from the book; predict the winner of a school election based on randomly sampled survey data. Gauge how far off the estimate or prediction might be.
CCSSHSS-ID.A.2
Use statistics appropriate to the shape of the data distribution to compare center (median, mean) and spread (interquartile range, standard deviation) of two or more different data sets.


