Math Mission: Data & Graphing Escape Room for 3rd Grade
What educators are saying
Also included in
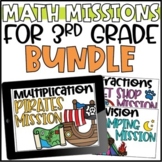
- This is the complete bundle of 3rd grade Math Missions - these are similar to escape rooms, but are no-prep for you! Just pull up the Powerpoint and hit GO! These are a great review for third grade math units and standards.What are Math Missions?Math missions are an escape room style game, but are cPrice $38.50Original Price $55.00Save $16.50
Description
Bring engagement and rigor to your classroom with 3rd Grade Math Missions!
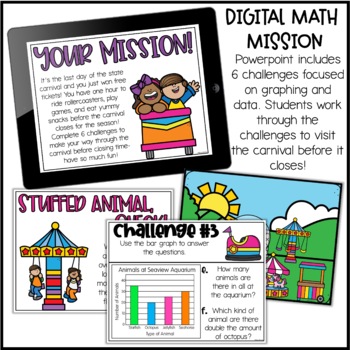
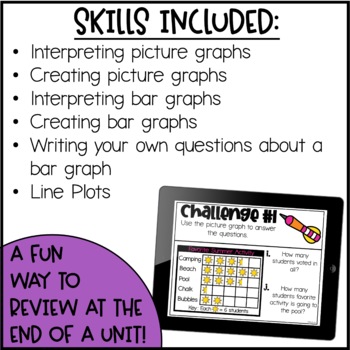
This is a great review for your data and graphing unit. Math missions are similar to an escape room - students will go on a mission to complete 6 challenges as they try and visit the carnival before it closes. They'll practice creating and interpreting picture graphs, bar graphs, and line plots.
The Math Missions
A math mission is a fun way to practice or review essential math skills. Students will receive a mission - to complete it they will solve 6 challenges. Each challenge focuses on a different strategy or type of math problem and includes 6-12 problems for students to work through. For this particular mission, students work to visit everything at the carnival before it closes, and practice skills related to picture graphs, bar graphs, and line plots.
How does it work?
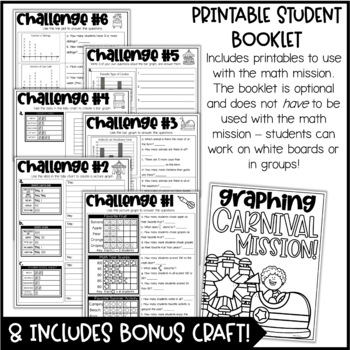
A Powerpoint will guide students through the mission - show this on a Smartboard or computer. Students will watch their progress on a map, and the challenges and problems are all included in the Powerpoint. There are printables included for students to use while working through the challenges, or you can let them work on whiteboards or in a group, depending on the setting you decide to use it in!
How will I use it?
- Whole Group: Use this as a review for a math unit - show the Powerpoint on your Smartboard or computer, and let students work in partners, groups, or individually to complete the mission. Students can use printables or whiteboards!
- Small Group: This can be 1-2 week's worth of small group plans during a math unit. You can work on this with small groups of students in small groups as you teach each skill and move through the unit.
- Independently: Let students work on the challenges independently as a math center as you move through a math unit - you can assign the Powerpoint to them individually or display a challenge for the day on the Smartboard.
What do I get?
- A Powerpoint that includes all mission and challenge information to display for students
- Printable student work booklet
- Math craft to top off the unit!

