M&M Probability Project
What educators are saying
Description
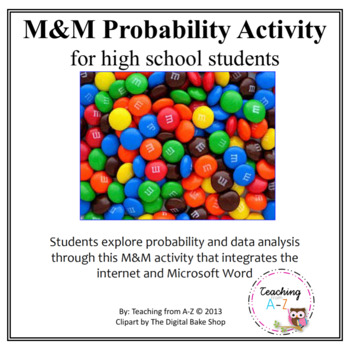
M&M Probability Project is a great project for high school students. I did this project with my Algebra 2 class composed of 34 students, 8 of which are Limited English Proficient (ESOL) students and 2 are Exceptional Student Education (ESE) students. They loved it! Students worked collaboratively in pairs on this M&M Probability Project, used the internet for research on creating different types of graphs, and practiced creating tables using Microsoft Word. ***Project links have been updated. Students can use Google Sheets or Excel or any other program to create their graphs. The project includes links to create them using Canva.
M&M Probability Project includes:
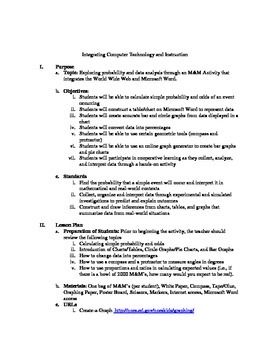
- complete lesson plan with objectives
- standards
- materials
- procedures
- M&M Probability Project student lab sheet and lab discussion questions. Students are guided through the lab to look at particular websites for guidance. Students are expected to turn in their results on a poster board.
M&M Probability Project duration:
This is a weeklong project.
M&M Probability Project prior learning prerequisite skills:
Prior to beginning the activity, students should have at least a basic understanding of:
- calculating simple probability and odds
- Charts/Tables
- Circle Graphs/Pie Charts
- Bar Graphs
- How to change data into percentages
- How to use a compass and a protractor to measure angles in degrees
- How to use proportions and ratios in calculating expected values (i.e., if there is a bowl of 2000 M&M’s, how many would you expect to be red).
Check out some of my other products:
Math in the Real World Project
Linear Equations and Line of Best Fit Housing Market Project
Earth Day Math for grades 6-12: Conversions, Graphs, and more!
Mother's Day Math: Solving Equations; Finding Surface Area and Volume
Parallelograms Properties Fairy Tale
Ratio, Proportions, Conversions and Unit Price Unit
Pythagorean Theorem for Middle and High School
Symmetry Project: Reflection, Rotation, & Translation
Teach Inverse, Converse, & Contrapositive Kinesthetically
Circumference, Area, and Equations of Circles Worksheets
Mean, Median, Mode, Range Practice Worksheet
Visit my blog at teachingfroma-z.com for tips, resources, and simple ways to make your life easier. Work smarter, not harder!
Please remember:
This purchase is for one teacher only. This resource is not to be shared with colleagues or used by an entire grade level, school, or district without purchasing the proper number of licenses. Multiple licenses can be purchased at a discounted price.
This resource may not be uploaded to the internet in any form, including classroom/personal websites or network drives. Leave feedback to earn credits for future purchases.


