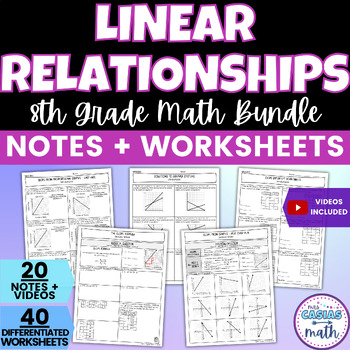
Linear Relationships Guided Notes and Worksheets BUNDLE 8th Grade Math
- Zip
Products in this Bundle (40)
showing 1-5 of 40 products
Bonus
Description
This bundle includes all the guided notes lessons, videos and differentiated worksheets you need to have your students learn and practice Linear Relationships! Each of the 20 identifying functions, slope, slope-intercept form, and more topics consist of two differentiated and leveled worksheets, plus a concise one page guided notes lesson that includes a video!
These notes and worksheets are a great way to teach, introduce and practice linear relationships (including real world applications and problem solving) no matter their level as the differentiation is already done for you!
THIS LINEAR RELATIONSHIPS BUNDLE INCLUDES:
GUIDED NOTES + VIDEOS:
- Identifying Functions from Tables, Mappings, and Ordered Pairs Notes + Video
- Identifying Functions from Graphs Notes + Video
- Types of Slopes from Graphs Notes + Video
- Slope from Graphs - Rise over Run Notes + Video
- Slope/Unit Rate from Proportional Graphs Notes + Video
- Slope Formula Notes + Video
- Slope & Similar Triangles from Graphs Notes + Video
- Slope from Graphs, Ordered Pairs & Tables Notes + Video
- Identifying Slope & y-intercept from Graphs & Tables Notes + Video
- Writing Slope-Intercept Form Equations Notes + Video
- Writing Equations in Slope-Intercept Form from Graphs Notes + Video
- Graphing Lines from Slope-Intercept Form Notes + Video
- Writing Equations in Slope-Intercept Form from Tables Notes + Video
- Writing Equations in Slope-Intercept Form from Real-World Situations Notes + Video
- Multiple Representations of Linear Relationships Notes + Video
- Slope-Intercept Form Graphic Organzier Notes + Video
- Slope-Intercept Form Tables on the Calculator Notes + Video
- Solutions to Graphed Linear Systems of Equations Notes + Video
- Proportional vs. Non-Proportional Notes + Video
- Direct Variation Notes + Video
You can find the video playlist where I work out these notes on my YouTube channel here.
These notes get straight to the point of the skill being taught, which I have found is imperative for the attention span of middle schoolers! They are also a great tool for students to refer back to.
DIFFERENTIATED WORKSHEETS:
- Identifying Functions Worksheets
- Vertical Line Test Worksheets
- Types of Slopes from Graphs Worksheets
- Finding Slope from Graphs Worksheets
- Slope from Proportional Graphs Worksheets
- Slope Formula Worksheets
- Slope and Similar Triangles Worksheets
- Slope from Graphs, Tables and Ordered Pairs Worksheets
- Identifying Slope and Y-Intercept Worksheets
- Slope-Intercept Form Equations Worksheets
- Slope-Intercept Form from Graphs Worksheets
- Graphing Lines in Slope-Intercept Form Worksheets
- Slope-Intercept Form from Tables Worksheets
- Slope-Intercept Form Real World Situations Worksheets
- Multiple Representations of Linear Relationships Worksheets
- Slope-Intercept Form Review Worksheets
- Slope Intercept Form Tables on the Calculator Worksheets
- Solutions to Graphs Systems Worksheets
- Proportional vs. Non-Proportional Worksheets
- Direct Variation Worksheets
Each of the above include:
● Worksheet Version A - 12 easier problems
● Worksheet Version B - 12 harder problems
● Answer Keys for both versions
There a total of 24 different problems on each worksheet - 12 in version A and 12 in version B. Version A is the easier version that includes more straight forward and skills-based problems. Version B is the harder version that includes more problem solving and word problems.
You can use both versions at the same time to differentiate, or use one version now and save another one for later. In the product, I include several ideas on the best ways to use both versions!
In this bundle, you can download the individual PDFs for each of the notes and worksheets listed out. I also include a PDF with all the bundled notes, YouTube links, worksheets & keys in one document as a bonus.
These notes, videos and worksheets align well with TEKS 8.4B, 8.4C, 8.5I, and much more! See the tagged standards for all.
Related & Similar Resources:
★ 8th Grade Math Pre-Algebra Guided Notes Mega Bundle


