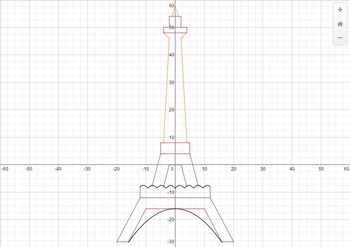
Linear Equations Project - Graphing the Eiffel Tower
Tyler McKell
125 Followers
Resource Type
Standards
CCSS8.EE.B.6
CCSS8.F.A.3
CCSSHSA-CED.A.2
CCSSHSF-IF.A.1
CCSSHSF-IF.B.5
Formats Included
- Zip
- Internet Activities
Pages
45 pages
Tyler McKell
125 Followers
Compatible with Digital Devices
The Teacher-Author has indicated that this resource can be used for device-based learning.
Description
Discover linear equations the fun way. This is a 5 day project that is ready to use. Implementing it in your class will be as easy as pi.
Students will need access to a computer or iPad. They will use a powerful online graphing calculator to create a drawing of the Eiffel tower via www.desmos.com.
Students will learn about:
Writing linear equations in point-slope form
Writing linear equations in slope-intercept form
Writing equations of parallel lines
Graphing horizontal and vertical lines
Using domain and range
Parabolas and sine waves (Just a little teaser)
What you will get:
40 slide dynamic PowerPoint presentation with lessons and practice for the topics listed above
Student worksheet (Word and PDF)
Teacher note page (Word and PDF)
Project Timeline (Excel)
Total Pages
45 pages
Answer Key
Included
Teaching Duration
1 Week
Report this resource to TPT
Reported resources will be reviewed by our team. Report this resource to let us know if this resource violates TPT’s content guidelines.
Standards
to see state-specific standards (only available in the US).
CCSS8.EE.B.6
Use similar triangles to explain why the slope m is the same between any two distinct points on a non-vertical line in the coordinate plane; derive the equation 𝘺 = 𝘮𝘹 for a line through the origin and the equation 𝘺 = 𝘮𝘹 + 𝘣 for a line intercepting the vertical axis at 𝘣.
CCSS8.F.A.3
Interpret the equation 𝘺 = 𝘮𝘹 + 𝘣 as defining a linear function, whose graph is a straight line; give examples of functions that are not linear. For example, the function 𝘈 = 𝑠² giving the area of a square as a function of its side length is not linear because its graph contains the points (1,1), (2,4) and (3,9), which are not on a straight line.
CCSSHSA-CED.A.2
Create equations in two or more variables to represent relationships between quantities; graph equations on coordinate axes with labels and scales.
CCSSHSF-IF.A.1
Understand that a function from one set (called the domain) to another set (called the range) assigns to each element of the domain exactly one element of the range. If 𝘧 is a function and 𝘹 is an element of its domain, then 𝘧(𝘹) denotes the output of 𝘧 corresponding to the input 𝘹. The graph of 𝘧 is the graph of the equation 𝘺 = 𝘧(𝘹).
CCSSHSF-IF.B.5
Relate the domain of a function to its graph and, where applicable, to the quantitative relationship it describes. For example, if the function 𝘩(𝘯) gives the number of person-hours it takes to assemble 𝘯 engines in a factory, then the positive integers would be an appropriate domain for the function.


