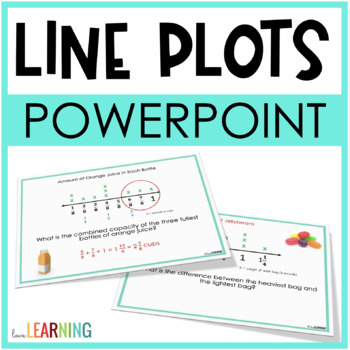
Line Plots with Fractions Slides Lesson - Math for 5th Grade
- PPTX
What educators are saying
Also included in
- These 5th Grade Math PowerPoint Lessons will completely simplify the way that you teach math for 5th grade students. All Lessons can be easily converted to Google Slides™ by opening them in your Google Drive™.Each 5th grade math lesson is scaffolded and builds upon itself so that students gain a deePrice $70.00Original Price $89.25Save $19.25
Description
This line plots with fractions lesson is perfect for your 5th-grade math classroom! Students will learn how to read a line plot, display data on a line plot, and redistribute data on a line plot using guided math practice and real-world math examples.
I have also included teacher notes and some editable slides in the PowerPoint to make this fit your math classroom whether you teach math workshop, guided math, or use math centers.
Students will learn:
- The definition of a line plot
- Different ways to read a line plot
- How to create a line plot and interpret the data
- How to use fractions with unlike denominators on a line plot
- How to add and subtract fractions on a line plot
- How to redistribute data on a line plot
- This lesson covers Common Core Standard 5.MD.2
*********************************************************************************************
REVIEWS FROM OTHER TEACHERS:
⭐️⭐️⭐️⭐️⭐️ Mrs. O Knows said, “I love that this gradually increased in difficulty because I think it really increased student understanding. I recorded a lesson using this for distance learning and students really grasped the concept! Thank you! "
⭐️⭐️⭐️⭐️⭐️ Savannah H. said, "This was awesome. My colleague who knows nothing about math used it flawlessly!"
⭐️⭐️⭐️⭐️⭐️ Cindy B. said, "This helped my students a lot this year. Line plots are so hard for 5th graders. This product helped them understand more this year. Thank you."
*********************************************************************************************
Do you want your students to Love ❤️ Learning Math?
Check out these other resources:
• Whole Number Division (NBT Standards)
• Expressions, Variables, and Order of Operations (OA Standards)
• Coordinate Planes and Numerical Patterns (OA Standards)
• Adding and Subtracting Decimals
• Fifth Grade Constructed Response Sheets
Other 5th Grade Measurement Resources:
• Measurement Conversions Unit
• Measurement, Line Plots, and Volume Student Notes
• Volume of Composite Figures Practice
• Volume of Rectangular Prisms Unit
SAVE with Bundles:
• Math Interactive Notebook Bundle
• Math PowerPoint Lessons Bundle
• 5th Grade Math Units for the YEAR
⭐ Let's get to know each other! ⭐
- Grab these FREE 5th Grade Word Problem Task Cards and get to know more about me by joining my email list!
- Follow Me on Instagram or Facebook
- If you have any questions, please email me: lovelearningtpt@gmail.com
©lovelearningtpt
Purchasing this product grants permission for use by one teacher in his or her own classroom or for one homeschool parent teaching his/her child. If you would like to share with others, please purchase additional licenses.


