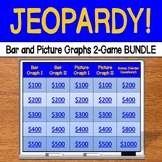
Jeopardy: Bar and Picture Graphs Game 1
- PPTX
Also included in
- **Check out more Jeopardy games here**This is the bundle of BOTH versions of bar and picture graphs Jeopardy. There are 2 different bar graphs and 2 different picture graphs in EACH game. One picture graph is in single units, while in the other picture graph each picture represents 5 units. This givPrice $6.00Original Price $8.00Save $2.00
Description
**Check out more Jeopardy games here**
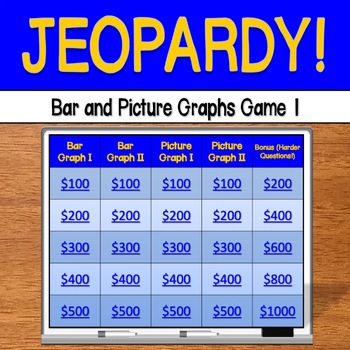
This Jeopardy game is a great review for bar graphs and picture graphs!
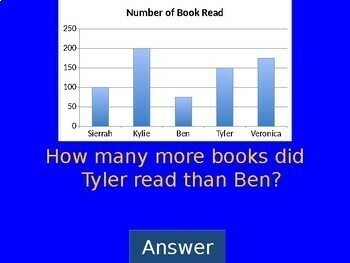
There are 2 different bar graphs and 2 different picture graphs in this game. Each bar graphs uses a different scale. Additionally, one picture graphs is in single units, while in the other picture graph each picture represents 5 units. This gives your students a variety of graphs to work with!
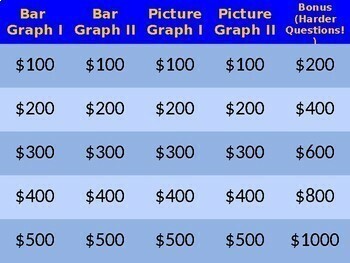
The game is fully clickable, meaning when you click on an amount, you are taken directly to that question. Each answer slide has a button to take you right back to the categories so you can select the next question.
This game is FUN and PERFECT for reviewing bar and picture graphs before a test!
**************************************************************************************************
Like Jeopardy games? Now you can build your own custom Jeopardy bundles!
Buy any 3 and save 33%. Buy any 4 and save 44%. Buy any 5 and save 50%.
**************************************************************************************************
*****************************************************************************************
Follow my store...all new resources are 50% off during first 72 hours!
*****************************************************************************************

