India Geography 6th Grade Statistics Mean Median Mode Range Box Plot Activity
- Zip
Products in this Bundle (2)
Also included in
- Enrich your geography study of ancient cultures using 6th Grade Statistics and Probability skills to analyze climate data. Calculate Measures of Central Tendency (mean, median, mode, range) and Mean Absolute Deviation. Master Box and Whisker Plots, Histograms, Dot Plots, Stem and Leaf Charts. WritePrice $24.32Original Price $30.40Save $6.08
- Enrich your study of ancient cultures using 6th Grade Statistics and Probability skills to analyze climate data. Calculate Measures of Central Tendency (mean, median, mode, range) and Mean Absolute Deviation. Master Box and Whisker Plots, Histograms, Dot Plots, Stem and Leaf Charts. Write StatisticaPrice $31.92Original Price $39.90Save $7.98
Description
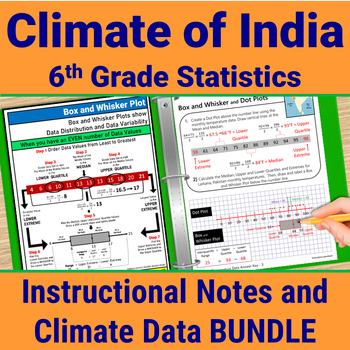
Enrich your study of India using 6th Grade stats skills to analyze India climate data. Master Data Display with Box and Whisker Plots, Histograms, Dot Plots, Stem and Leaf Charts. Calculate Measures of Central Tendency (mean, median, mode, range) and Mean Absolute Deviation. Write Statistical Questions. Analyze Data Distribution and Data Variability.
All with climate data (temperature and precipitation) from ancient Indian sites!
This Print and Go STEM/STEAM PBL resource includes 120 pages of Instructional Notes, Climate Data, and Graphing Templates.
- Step-by-Step Instructional Notes teach EVERY 6th Grade Statistics and Probability standard. Aligns with CCSS.
- Then, apply 6th grade statistics skills to India Climate Data (temperature + precipitation) from Larkana, Pakistan (by ancient city of Mohenjo-Daro) and Mt. Kailash, Tibet (main source of the Indus River and sacred to Hinduism)
- Draw Climate Graphs
- Calculate Measures of Central Tendency (Mean, Median, Mode and Range) and Mean Average Deviation
- Complete Frequency Tables and Draw Histograms
- Draw Stem and Leaf, Box and Whisker, and Dot Plots
- Write Statistical Questions
- Describe Data Distribution and Data Variability
- Apply climate analysis of Larkana and Mt. Kailash to the settlement of Ancient India.
- Complete Answer Keys provided
LOW PREP!
All files are provided in PDF and PPT formats. Convert PPT files to Google Slides for upload to your Google Classroom share site with restricted student-only password-protected access.
Check out my PREVIEW for a detailed look at included pages.
Perfect STEAM station activity, test prep, substitute assignment, early finisher independent work.
Additional Materials required (not included with this Resource):
- Rulers, Markers or Colored Pencils
- Students will need to know Decimal Operations and Absolute Value for calculations
Related Resources:
- FULL-YEAR Climate Data STEAM BUNDLE - 6th Grade Statistics Instructional Notes AND Data Sets for Mesopotamia, Egypt, India, China - Keep skills fresh all year!
- FULL-YEAR Climate Data STEAM BUNDLE - 6th Grade Statistics Instructional Notes AND Data Sets for Mesopotamia, Egypt, India, China, Greece, and Rome - Keep skills fresh all year!
Click HERE to FOLLOW Middle Grades Math and be the first to know when new Middle Grades math resources are released.
New Resources are offered at 1/2 OFF for the FIRST 24 HOURS!
RATE THIS RESOURCE and earn valuable TPT credits to offset future purchases.
LEAVE A REVIEW to help others purchase with confidence.
Don’t hesitate to email me with any questions. Middlegradesmath2018@gmail.com.
©Mary Jenkins Middle Grades Math. All rights reserved. This resource is for non-commercial classroom use by one teacher/classroom only. This product may be printed for classroom use or posted on a classroom share site with restricted student only password-protected access. Copying, editing, selling, redistributing, or posting any part of this product on the internet in any form (even a personal/classroom website or blog) is strictly forbidden. This product may not be used on online education sites, including, but not limited to, Outschool. Violations are subject to the penalties of the Digital Millennium Copyright Act.


