Hurricane Harvey Claim Evidence Reasoning Graphic Organizer
- Zip
What educators are saying
Also included in
- This resource is packed with easy to use, easy to grade, no prep, scientific current events, using the NGSS Science and Engineering practice of Engaging in Argument from Evidence. Students learn about a variety of science topics through a C.E.R. (Claim Evidence Reasoning) graphic organizers. This isPrice $47.00Original Price $91.75Save $44.75
- -Students learn about a variety of current events regarding Human Impacts on Earth through a C.E.R. (Claim Evidence Reasoning) graphic organizer. This is great for scaffolding content, sub plan, independent work, homework, review or distance learning. What Students do:The students figure out what thPrice $24.00Original Price $45.50Save $21.50
Description
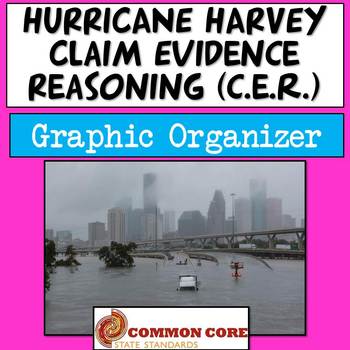
With this product students will understand the science and impact of Hurricane Harvey. Students will use evidence in the article that climate change may be a contributing factor to the intensity of Hurricane Harvey from a reputable science website.
Claim Evidence Reasoning or C.E.R. charts are great for getting your students to explain phenomena in a meaningful way and it allows you as the instructor to adequately assess their understanding of concepts. The students figure out what the "Claim" is in the article, they then use data that supports the claim in the "Evidence" section, draw visual evidence and then explain why the evidence supports the claim in the "Reasoning " section.
You get a CER graphic organizer, the key, the article and the link to the website which is at the end of the article. This can be used as a current event and/or relating to weather, pressure and states of matter.
Thank you for taking a look!
Please follow me on TpT for new products and check me out on Instagram for my products in action!
https://www.instagram.com/williamshandsonscience/
Take a look at some other products in my store:
Elements, Atoms, Compounds and Molecules Card Sort
Flipping the Classroom Periodic Table Frayer Models
Physical Science Scaffolded Notes
NGSS Speed, Time, Distance, Acceleration and Graphing Worksheets
Physics Speed, Time and Distance Problems
STEM Paper Airplane Competition
Physical Science Scaffolded/Guided Notes for a Year + 8 PREZIS
NGSS Kinetic and Potential Energy Card sort


