How to READ a PICTURE GRAPH & OBSERVE PLANT LIFE CYCLES~Math&Science Mini-Book
The School of Athens Mind Adventures
52 Followers
Grade Levels
1st - 4th
Subjects
Resource Type
Formats Included
- PDF
Pages
8 pages
The School of Athens Mind Adventures
52 Followers
Description
Math and Science Mini-Book for helping students
Identify the Critical Content of Picture Graphs and Plant Life Cycle stages
~ Element 6 ~
No prep needed. Everything is done for you and ready to go.
Just print off the copies you need. Word bank and answer key included.
Included:
Personalized six-page Math and Science Mini-Book with Academic Vocabulary highlighted
My Name is ___ and I Learned how to Read a Picture Graph of Plant Life Cycles Today
Learning Goals Aligned with Common Core standards
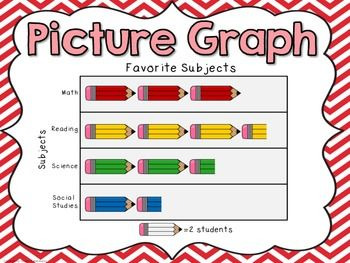
MA.2.MD.4.10 Draw a picture graph and a bar graph (with single-unit scale) to represent a data set with up to four categories. Solve simple put-together, take-apart, and compare problems using information presented in a bar graph.
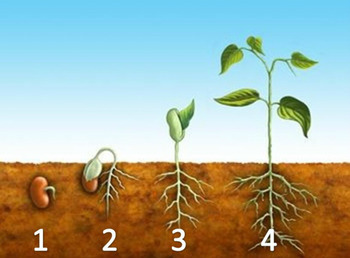
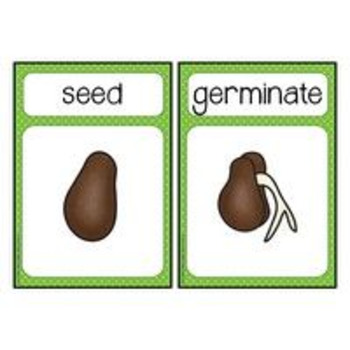
SC.2.L.16.1 Observe and describe major stages in the life cycles of plants and animals, including beans and butterflies.
*Can also be used in reading as it is aligned with Common Core standard: LAFS.2.RI.3.7 ~ Explain how specific images (e.g., a chart showing data collected) contribute to and clarify a text.
Aligned with:
Go Math! Lesson 10.2 ~ Read Picture Graphs
Science Fusion Lesson ~ Unit 9 Lesson 3 ~ What are Some Plant Life Cycles?
Total Pages
8 pages
Answer Key
N/A
Teaching Duration
30 minutes
Report this resource to TPT
Reported resources will be reviewed by our team. Report this resource to let us know if this resource violates TPT’s content guidelines.


