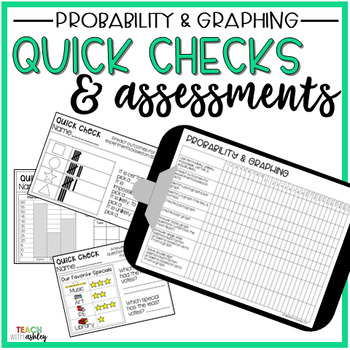
Guided Math Quick Checks & Assessments Probability & Graphing
Teach With Ashley
5.6k Followers
Grade Levels
1st - 3rd
Subjects
Resource Type
Formats Included
- PDF
Pages
28 pages
Teach With Ashley
5.6k Followers
Also included in
- Looking for a product that includes engaging 21st century centers for students to use during guided math? Want a guided math product that has ideas for you to implement that is low prep? This is it! This bundle takes you from beginning to end. It includes everything you need for an engaging, studentPrice $18.00Original Price $28.50Save $10.50
- This Guided Math Quick Checks & Assessment product includes… • Standards Based Checklist (Based on 2nd Grade Virginia Standards of Learning) • Pre-Assessment • End of Unit Test • Quick Checks for Formative Grades or Retesting BUNDLE Guided Math Quick Checks & Assessments includes ALL 10 ofPrice $25.00Original Price $30.00Save $5.00
Description
This Guided Math Quick Checks & Assessment product includes…
• Standards Based Checklist (Based on 2nd Grade Virginia Standards of Learning)
• Pre-Assessment
• End of Unit Test
• Quick Checks for Formative Grades or Retesting
This product includes…
-3 pages explaining how to implement this product
-3 pages of data sheets
-1 page of pretest
-7 pages of tests (probability quiz, graphing quiz, & probability and graphing quiz)
-Answer keys for both pretests & tests
-9 pages of quick checks aligned to each skill taught during the unit ( There are 4 of the same quick check per page to make printing easier)
Here are some ways that quick checks can be used:
• Exit ticket following a whole/small group lesson.
• Warm up for a previous skill taught
• Retesting a specific skill
This unit is linked to the 2nd Grade Virginia Math Standards. The {Probability & Graphing} Unit includes the following standards:
•VA SOL 2.17
Use data from experiments to construct picture graphs, pictographs, & bar graphs.
•VA SOL 2.18
Use data from experiments to predict outcomes when the experiment is repeated.
•VA SOL 2.19
Analyze data displayed in picture graphs, pictographs, & bar graphs.
•VA SOL 2.8
Create & solve one & two step addition & subtraction problems, using data from simple tables, picture graphs, pictographs, & bar graphs.
Teach With Ashley Blog
TPT Store
Instagram
Facebook
Pinterest
• Standards Based Checklist (Based on 2nd Grade Virginia Standards of Learning)
• Pre-Assessment
• End of Unit Test
• Quick Checks for Formative Grades or Retesting
This product includes…
-3 pages explaining how to implement this product
-3 pages of data sheets
-1 page of pretest
-7 pages of tests (probability quiz, graphing quiz, & probability and graphing quiz)
-Answer keys for both pretests & tests
-9 pages of quick checks aligned to each skill taught during the unit ( There are 4 of the same quick check per page to make printing easier)
Here are some ways that quick checks can be used:
• Exit ticket following a whole/small group lesson.
• Warm up for a previous skill taught
• Retesting a specific skill
This unit is linked to the 2nd Grade Virginia Math Standards. The {Probability & Graphing} Unit includes the following standards:
•VA SOL 2.17
Use data from experiments to construct picture graphs, pictographs, & bar graphs.
•VA SOL 2.18
Use data from experiments to predict outcomes when the experiment is repeated.
•VA SOL 2.19
Analyze data displayed in picture graphs, pictographs, & bar graphs.
•VA SOL 2.8
Create & solve one & two step addition & subtraction problems, using data from simple tables, picture graphs, pictographs, & bar graphs.
Teach With Ashley Blog
TPT Store
Total Pages
28 pages
Answer Key
N/A
Teaching Duration
N/A
Report this resource to TPT
Reported resources will be reviewed by our team. Report this resource to let us know if this resource violates TPT’s content guidelines.


