Growing 6th Grade Statistics Resources
Math With Ms Yi
3.5k Followers
Grade Levels
6th - 8th
Subjects
Resource Type
Standards
CCSS6.SP.A.1
CCSS6.SP.A.2
CCSS6.SP.A.3
CCSS6.SP.B.4
CCSS6.SP.B.5c
Formats Included
- Zip
- Google Apps™
Pages
16 pages
Math With Ms Yi
3.5k Followers

Includes Google Apps™
This bundle contains one or more resources with Google apps (e.g. docs, slides, etc.).
Products in this Bundle (4)
Also included in
- This is a bundle of digital lessons and practice that is perfect for 6th grade math.Super easy to use with Google Classroom!Also check out:7th Grade Math Digital Resource Bundle+ Don't forget to leave feedback to earn TPT credits for future purchases!+ If you use this resource, I'd love to see snapsPrice $45.00Original Price $90.00Save $45.00
Description
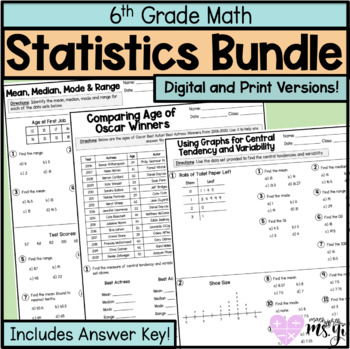
Need some real life statistics problems, notes or extra practice? This click and print bundle is easy to use and is also available digitally for distance learning. Works well with Google Classrooms.
Each Product is Available With :
- Paper version for print
- Digital version
- Detailed Answer Key
Topics Covered
- Finding central tendency and variability data
- Creating box plots
- Interpreting box plots
- Reading Graphs
+ Don't forget to leave feedback to earn TPT credits for future purchases!
+ If you use this resource, I'd love to see snaps of it in action in your room. Tag me on @mathwithmsyi
Total Pages
16 pages
Answer Key
Included
Teaching Duration
N/A
Last updated Mar 30th, 2020
Report this resource to TPT
Reported resources will be reviewed by our team. Report this resource to let us know if this resource violates TPT’s content guidelines.
Standards
to see state-specific standards (only available in the US).
CCSS6.SP.A.1
Recognize a statistical question as one that anticipates variability in the data related to the question and accounts for it in the answers. For example, “How old am I?” is not a statistical question, but “How old are the students in my school?” is a statistical question because one anticipates variability in students’ ages.
CCSS6.SP.A.2
Understand that a set of data collected to answer a statistical question has a distribution which can be described by its center, spread, and overall shape.
CCSS6.SP.A.3
Recognize that a measure of center for a numerical data set summarizes all of its values with a single number, while a measure of variation describes how its values vary with a single number.
CCSS6.SP.B.4
Display numerical data in plots on a number line, including dot plots, histograms, and box plots.
CCSS6.SP.B.5c
Giving quantitative measures of center (median and/or mean) and variability (interquartile range and/or mean absolute deviation), as well as describing any overall pattern and any striking deviations from the overall pattern with reference to the context in which the data were gathered.


