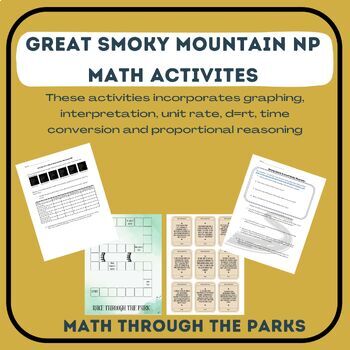
Great Smoky Mountain NP Math Activity: Rate, D=RT, Proportional Reasoning
- PDF
Description
There are 3 lessons in this bundle. All of these lessons incorporate Great Smoky Mountain National Park and real data and trails. This is a great activity if you are traveling to this park or create a virtual trip in your classroom. The activity's include hiking in GSMNP, driving in the park, and a board game with a variety's of questions all applied to the park.
Hiking in GSMNP
This activity incorporates the following skills:
· Converting minutes to hours and hours to minutes
· Unit rate
· Graphing and Interpreting
· Unit Rate
· D=RT
· Real world application
· Proportional Reasoning
Calculating Distance
This activity incorporates the following skills:
· Converting minutes to hours and hours to minutes
· Unit rate
· Unit Rate
· D=RT
· Adding and Subtracting Decimals
· Percents (find the missing parts)
· Real world application
· Proportional Reasoning
· Geography
GSMNP Board Game
- Topics Covered
o Ratios, rates, percent's (part of a whole and part of a part), proportional relationships, d=rt, converting time, converting units in real world
- The activity includes an answer key. In order to read the answers you may need to teach the students how to find their answers
In your group take turns flipping a question card then answering the question. If your answer is correct, roll the die and move forward that many spaces. The first person to the end wins.
- If you land on the bridge, you either go up or down depend on which side you land on.
- Use an object such as a lego, eraser, dime, or piece pf paper to be your place marker.


