Graphs & Data Math Slides for Graphing with Pictographs, Bar Graphs & Charts
- Zip
- Google Apps™

What educators are saying
Also included in
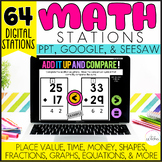
- Are you looking for digital slides to enhance the math learning in your classroom? These 64 math activities are digital so that your students can use them in the classroom or through distance/virtual learning. All 64 activities are provided in PowerPoint, SEESAW, and Google Slides.All the Info:PowPrice $48.50Original Price $72.25Save $23.75
Description
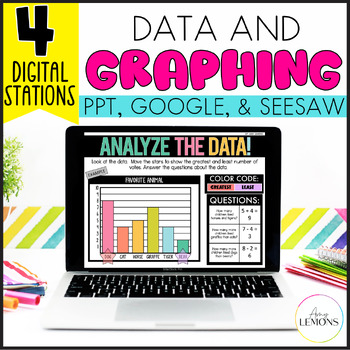
Are you looking for digital activities to reinforce the skill of Analyzing Graphs and Data? These 4 activities involve students creating and analyzing graphs (pictographs, charts, and bar graph)s All 4 activities are provided in PowerPoint, SEESAW, and Google Slides.
All the Info:
Power Point Users: There are 4 files that you can simply open up and use... or add them to your Google Account/Platform of choice
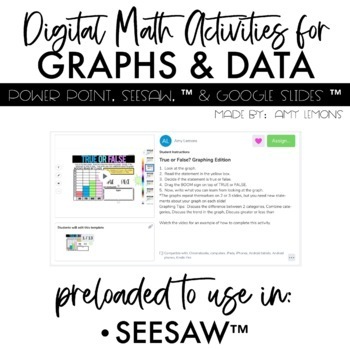
SEESAW Users: These activities are preloaded. With just a click (that is provided) you can save and assign the activities
GOOGLE Users: You can download the files directed to your Google account with just the click of a button! Or you can manually add the PowerPoints if you prefer that!
VIDEO Directions: I have included a screen recording video for all three platforms listed above so that you know exactly how to use these resources.
About the Activities (That can be used in SEESAW, GOOGLE Classroom, or through PowerPoint):
*All activities have 13 slides. The first slide is an example slide so students know exactly what to do!
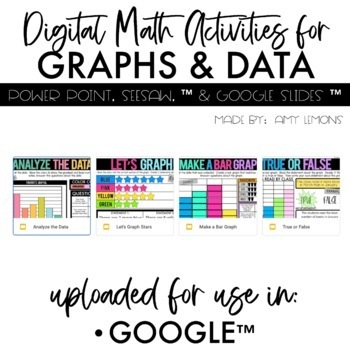
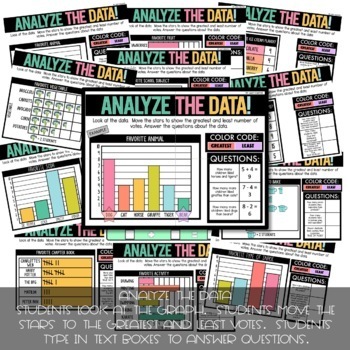
1. Analyze the Data: Students are shown a graph or chart. Students drag two stars to show the category with the greatest votes and the category with the least number of votes. Students then answer three questions about the data shown by typing in text boxes. (vertical bar graphs with scale of 1, horizontal bar graphs with scale of 1, pictographs with scale of 2, charts, tally chart)
2. Let's Graph!: Students are given a set of stars. Students drag the stars to create a pictograph with the given amount. Then, students type 2 statements about their pictograph.
3. Make a Bar Graph: Students are given a set of data in a pictograph. Students must take that data and put it into a bar graph. Then, students answer questions about the data by typing in the text boxes.
4. True or False?: Students are given bar graphs that show trends. Students look at the graph. Students read a given statement about the graph. Students decide if that statement is true or false. Students drag the BOOM symbol over True or False. Students then type one statement about what they learned from their graph.
*The graphs have anywhere from 3-6 categories. Most graphs are on a scale of 1, but there are some with varying scales. The True or False activity has graphing trends.
*This purchase is for SINGLE USE ONLY. To share with other teachers or teammates, an additional license will need to be purchased.
Please feel free to ask any questions in the Q&A section of my TpT store.
For more digital activities, look below:
- The Digital Math Activity BUNDLE
- 2 Digit Addition with Regrouping
- Place Value of 2 Digit Numbers
- Place Value of 3 Digit Numbers
- Compare and Order 2 Digit Numbers
- Compare and Order 3 Digit Numbers

