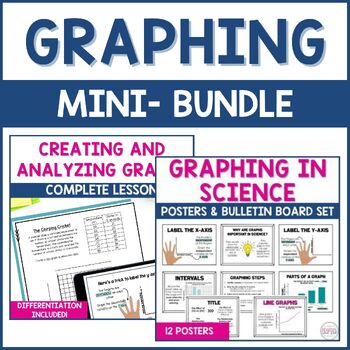
Graphing in Science Creating and Analyzing Graphs Bundle
Products in this Bundle (2)
Description
Are your students struggling to set up graphs correctly in science? Whether your students are just getting started creating bar and line graphs, or need more practice interpreting and analyzing graphs, here’s help! This complete unit is full of no-prep practice to help your students master the art of graphing and save you time!
Help your students understand how to set up bar and line graphs step by step. Students will analyze graphs and use data on the graph to make predictions. This extensive unit includes a presentation for modeling and TONS of practice to help build confidence in graphing.
Here’s what’s inside this graphing resource:
- PowerPoint Presentation – also available as a Google Slides presentation
- Notes aligned to the presentation (fill in the blank and a completed copy great for teachers or students who need more support)
- 2 Title and axis practice pages and answer keys
- 10 Differentiated Practice Graphs
- Group 1 – instructs students which type of graph to make
- Group 2 – students determine if line or bar graph is needed
- Group 3 – X and Y axis are completed (this is for students who need the most support) – PDF
- Answer key – PDF
- Rubric (editable)
- Student Graph Checklist (editable)
- 4 Anchor charts
Why purchase this product?
- No prep - just print and go!
- Differentiation included for learners of various abilities
- Saves you time
- Engaging for students
- Editable rubric and student graph checklist
- Google Slide presentation is easy to share on Google Classroom
GRAPHING POSTER/BULLETIN BOARD SET
This set of 12 graphing posters is the perfect way to support students and their graphing skills all year long. This graphing resource helps outline simple tips to help students create accurate graphs in science.
Add a meaningful bulletin board to your classroom that will help your students become more independent in their graphing skills.
Tips and tricks in this set include:
- setting up the x and y axis
- creating titles
- simple steps to create a graph
- TAILS - graphing checklist
Here’s what’s inside:
- 12 high quality posters (8.5x11) in 300 dpi for high quality printing
- Instructions to print larger versions from your own computer.
Why purchase this product?
- No prep - just print and go!
- Encourage independence with graphing
- Meaningful bulletin board you an leave up all year
SAVE WITH THIS BUNDLE!
_______________________
Copyright © Beakers and Ink
Permission to copy for single classroom use only.
Please purchase additional licenses if you intend to share this product.


