Graphing and Data Math Project
- Zip
- Google Apps™

What educators are saying
Also included in
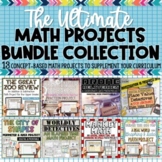
- These real-world math projects have changed my math instruction and increased my students' critical thinking skills! This bundle of math projects includes thirteen discounted concept-based, differentiated, best-selling math projects. 13 *Highly Rated,* concept-based projects are included.WonderingPrice $31.99Original Price $51.87Save $19.88
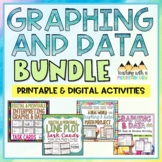
- Think critically about graphs and data with this set of ENGAGING and RIGOROUS resources for upper elementary math. Help your students learn to interpret a variety of graphs, line plots, and data sets with these hands-on activities, math projects, and task card sets that are perfect for differentiatiPrice $7.59Original Price $12.78Save $5.19
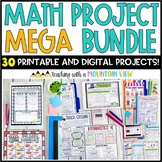
- Take engagement and rigor to the next level with these high-interest math projects for upper elementary. I have designed my math projects to be highly engaging, student-driven, real-world, and enriching. You’ll have a project for every occasion all year long! This bundle of THIRTY digital and printaPrice $71.99Original Price $126.20Save $54.21
Description
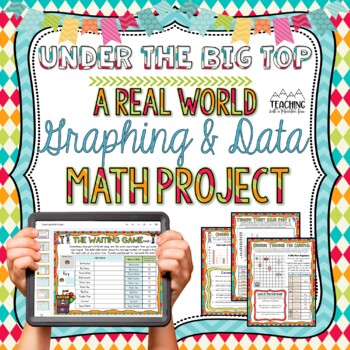
Your students will love working on this digital and printable 12-page graphing and data math project with a fun and engaging carnival theme! They will interpret data tables and graphs as well as create their own data tables and graphs. Each page also includes tasks and questions about each graph!
The pages stand alone, so you can use a few of the pages or all of them depending on how much time you have and the skills your students are ready to review. (Making them PERFECT for DIFFERENTIATION!)
What skills are covered in this Graphing and Data Math Project?
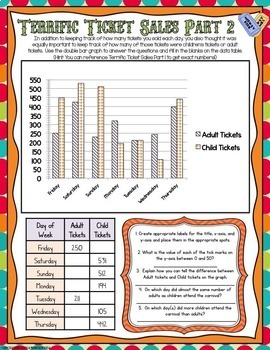
- Bar Graphs & Double Bar Graphs (Includes creating a bar graph from a data table) 2 Pages
- Line Graphs (Includes creating a double line graph from a data table) 2 Pages
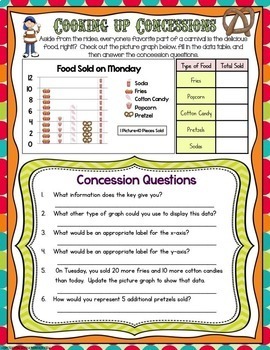
- Picture Graphs (Includes creating a picture graph) 2 Pages
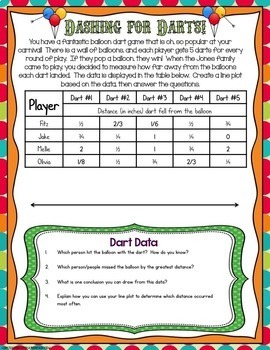
- Line Plots (Includes creating a line plot with fractional measurements) 2 Pages
- Circle Graphs (Includes creating and converting circle graph data to another graph type) 1 Page
- Coordinate Plane Graphs 1 page
- Creating Data Set & Graph Enrichment 1 Page
- Extension Activities 1 Page
What else is included in this Graphing and Data Math Project?
- Graphing and Data Printable Project (STANDARD version)
- Graphing and Data Printable Project (METRIC version - uses centimeters, millimeters, and degrees Celsius!)
- A digital, Google Slides, version with interactive and movable pieces. Available in both standard and metric versions.
- An answer key!
Ideal for Grades 3-6
What are teachers saying about this graphing project?
"This Math project booklet is an incredible resource. It has the students working on real life examples and connects to the content I am teaching." - Bree F.
"Used this as an enrichment project for my early finishers with our data unit and my students loved it! Very engaging and helped them apply what they had learned." - TeachinginNC
"I really struggled trying to find materials for digital math projects, but this one has been a real winner. My class is about half-way through this project, and I am happy to say that they are very engaged and interested in completing this. It's challenging, but that's one of the best things about it. It really pushes my students to take the time and figure out the information being presented. This is a resource that I will definitely use again!" - Julie G.
"Another great math project from Teaching with a Mountain View! It's super engaging. My students always cheer when they see we are doing another. They don't consider these 'work' because they are so much fun to complete..." Cynthia L.
MORE Graphing & Data Resources

