Graphing and Analyzing Data | Math Center Activities
KC Kindergarten
7.9k Followers
Description
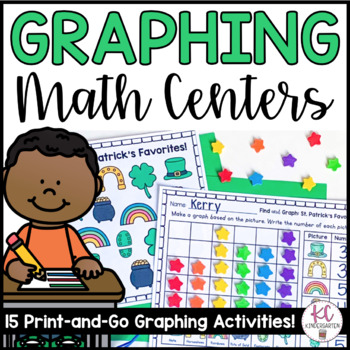
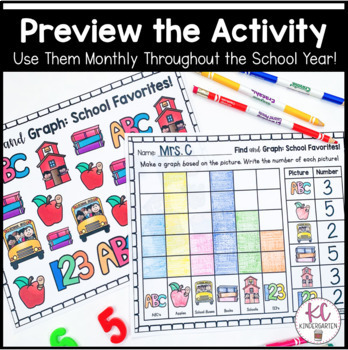
These 15 activities are the perfect way for students to practice graphing and counting! Students will play "I Spy" with the included Find and Graph searches to count how many of each picture type they can see and build a graph. They can color to create a graph, use dot paints, or build one with mini erasers/other fun manipulatives! This would be a great activity for math centers, homework, small group work, distance learning challenges, morning tubs, etc!
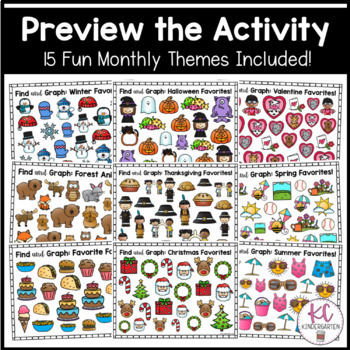
The following 15 themed searches are included:
- Find and Graph: Zoo Animals
- Find and Graph: Forest Animals
- Find and Graph: Arctic Animals
- Find and Graph: Favorite Pets
- Find and Graph: Favorite Foods
- Find and Graph: Candy Fun
- Find and Graph: Back to School Favorites (August/September)
- Find and Graph: Halloween Favorites (October)
- Find and Graph: Thanksgiving Favorites (November)
- Find and Graph: Christmas Favorites (December)
- Find and Graph: Winter Favorites (December/January)
- Find and Graph: Valentine Favorites (February)
- Find and Graph: St. Patrick's Favorites (March)
- Find and Graph: Spring Favorites (April/May)
- Find and Graph: Summer Favorites (June/July)
Please note: All of the searches will have between 1 - 5 pictures of each image.
If you use this product, I'd love to see/hear from you! Any feedback is SO appreciated and gives you TPT credits to use on future purchases! ♥️
- Instagram: @KC.Kindergarten
- Email: kckindergartentpt@gmail.com
- TPT: Follow my store and be the first to know about new products and sales!
Total Pages
33 pages
Answer Key
N/A
Teaching Duration
N/A
Report this resource to TPT
Reported resources will be reviewed by our team. Report this resource to let us know if this resource violates TPT’s content guidelines.


