
Graphing Task Cards | Interpreting Graphs and Data


- Zip
- Google Apps™

What educators are saying
Also included in
 An absolute must-have, MASSIVE math task card bundle. I have been asked over and over to bundle all of my task card collections together, and here it is! There are over 2,000 Math Task Cards in this huge discounted bundle of all my bundles (PLUS ELEVEN sets of previously unbundled task cards!) ThePrice $138.99Original Price $184.57Save $45.58
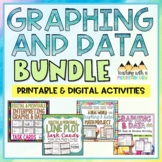 Think critically about graphs and data with this set of ENGAGING and RIGOROUS resources for upper elementary math. Help your students learn to interpret a variety of graphs, line plots, and data sets with these hands-on activities, math projects, and task card sets that are perfect for differentiatiPrice $9.49Original Price $12.78Save $3.29
Description
Your students will love reviewing graphing and data with this set of 32 half-page Graphing Task Cards for interpreting graphs and data. Each of the graphing task cards is digital and printable and has 4 question prompts on each card, for a total of 128 questions on interpreting graphs !
These task cards are available in both a PRINTABLE version and a DIGITAL Google Slides Version.
Types of graphs include:
Bar Graphs
Double Bar Graphs
Line Graphs
Double Line Graphs
Pictographs
Pie Graph (Circle Graph)
Line Plot
2 Interpreting data chart cards
4 Generate a graph cards*
*Not included in digital access version
These are perfect for test prep, reviewing graphing and data, daily warm up, etc. Have fun!
**Updated March 2020
ANSWER KEY & RECORDING SHEET INCLUDED!
MORE Graphing & Data Resources
Graphing and Data Math Project
Graphing Task Cards
Data Task Cards
Interpreting Graphs
Interpreting Data
