TPT
Total:
$0.00

Graphing Parent Functions | Linear | Quadratic | Exponential | Absolute Value

Rated 4.77 out of 5, based on 137 reviews
4.8Ā (137 ratings)
;
Algebra and Beyond
7.4k Followers
Grade Levels
9th - 12th
Standards
Formats Included
  • PDF
Pages
19 pages
$4.00
List Price:
$5.00
You Save:
$1.00
$4.00
List Price:
$5.00
You Save:
$1.00
Share this resource
Report this resource to TPT
Algebra and Beyond
7.4k Followers

What educators are saying

I made these into little posters to hang around the room. I also printed multiple on one page for students to include these in their notebooks.
This was a great graphic organizer to be able to assist my students in their re-learning of parent functions

Description

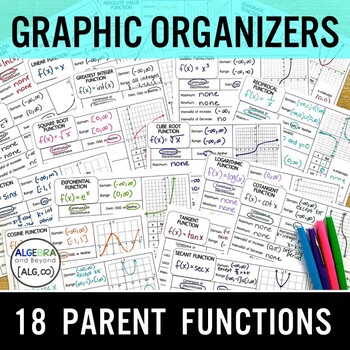
These parent function graphic organizers help students input function table data, graph functions, and analyze different parts of each graph. They are a perfect and easy way for students to identify and learn about each parent function ā€“ including linear, quadratic, exponential, absolute value, and more! These clear and concise graphic organizers can be used as a print and go packet or add to interactive notebooks.

18 Parent Functions - Graphic Organizers:

ā€¢ Linear

ā€¢ Absolute Value

ā€¢ Quadratic

ā€¢ Greatest Integer

ā€¢ Cubic

ā€¢ Reciprocal

ā€¢ Square Root

ā€¢ Cube Root

ā€¢ Exponential

ā€¢ Logarithmic

ā€¢ Natural Logarithm

ā€¢ Logistic

ā€¢ Sine

ā€¢ Cosine

ā€¢ Tangent

ā€¢ Cotangent

ā€¢ Secant

ā€¢ Cosecant

ā€¢ AND a blank one!

The graphic organizers include domain, range, continuity, symmetry, local maxima and minima, periods, asymptotes, intervals of increase and decrease, end behavior, x and y-intercepts, a table of points, and a graph.

*Now includes a version WITHOUT continuity and symmetry.

Two graphic organizers per page. A perfect size for an interactive notebook! Students can fill them in or a typed answer key version is included as well. These are great to give to students each time a new function is introduced.

Click on the PREVIEW button above to view the graphic organizers.

ā­ DID YOU KNOW?!?! ā€“ You can earn TPT CREDIT by leaving a review!!! I appreciate all feedback on my resources! ā­


Looking for more function activities?

Parent Functions Matching Activity

Real World Quadratic Functions Project

Piecewise Functions Lesson

Inverse Functions Lesson

Graphs of Linear Functions Matching Activity

Graphs of Quadratic Functions Matching Activity

Piecewise Functions Project

Graphs of Rational Functions Matching Activity

Graphs of Polynomial Functions Matching Activity

Transformations of Functions Notes: Quadratic | Absolute Value | Square Root

Transformations of Trigonometric Functions Lesson

āˆžāˆžāˆžāˆžāˆžāˆžāˆžāˆžāˆžāˆžāˆžāˆžāˆžāˆžāˆžāˆžāˆžāˆžāˆžāˆžāˆžāˆžāˆžāˆžāˆžāˆžāˆžāˆžāˆžāˆžāˆžāˆžāˆžāˆžāˆžāˆžāˆžāˆžāˆžāˆžāˆžāˆžāˆžāˆžāˆžāˆžāˆž

Ā© Algebra and Beyond

This product is intended for personal use in one classroom only. For use in multiple classrooms, please purchase additional licenses.

Total Pages
19 pages
Answer Key
N/A
Teaching Duration
N/A
Report this resource to TPT
Reported resources will be reviewed by our team. Report this resource to let us know if this resource violates TPTā€™s content guidelines.

Standards

to see state-specific standards (only available in the US).
Understand that a function from one set (called the domain) to another set (called the range) assigns to each element of the domain exactly one element of the range. If š˜§ is a function and š˜¹ is an element of its domain, then š˜§(š˜¹) denotes the output of š˜§ corresponding to the input š˜¹. The graph of š˜§ is the graph of the equation š˜ŗ = š˜§(š˜¹).
Use function notation, evaluate functions for inputs in their domains, and interpret statements that use function notation in terms of a context.
For a function that models a relationship between two quantities, interpret key features of graphs and tables in terms of the quantities, and sketch graphs showing key features given a verbal description of the relationship.
Graph functions expressed symbolically and show key features of the graph, by hand in simple cases and using technology for more complicated cases.
Graph linear and quadratic functions and show intercepts, maxima, and minima.

Reviews

Questions & Answers

7.4k Followers