


Scaffolded Math and Science
30.3k Followers
Resource Type
Standards
CCSSHSF-IF.C.7
CCSSHSF-IF.C.7e
CCSSHSF-BF.B.3
CCSSHSF-LE.A.2
Formats Included
- PDF
Pages
2 pages
Scaffolded Math and Science
30.3k Followers
Also included in
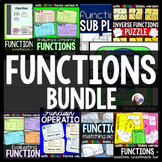 This big bundle of printable and digital functions activities can be used for practice, review, group work, partner work, or even as informal assessment in your algebra class. All answer keys are included as well as student answer sheets to make grading easier.You can read more about the resources,Price $36.00Original Price $65.50Save $29.50
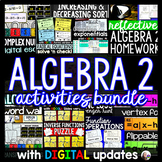 This algebra 2 activities bundle includes all of the current printable and digital algebra 2 activities in my store, along with all future additions. All updates to the bundle are free.Topics covered:Exponentials, inverses, complex numbers, domain and range, increasing and decreasing, logarithms, rPrice $60.00Original Price $155.00Save $95.00
Description
This reference sheet for graphing exponential functions walks Algebra students through identifying x and y shifts, identifying the parent function, creating a table for the parent function, shifting the parent table, plotting the points from the shifted table and sketching in the horizontal asymptote.
Students can color the reference sheet to personalize it for their notebooks or binders. The sheet can also be enlarged into a poster as an anchor chart for graphing exponentials. *Includes link to YouTube video tutorial.
You may also like:
Exponential Growth and Decay Digital Math Escape Room
Total Pages
2 pages
Answer Key
N/A
Teaching Duration
N/A
Report this resource to TPT
Reported resources will be reviewed by our team. Report this resource to let us know if this resource violates TPT’s content guidelines.
Standards
to see state-specific standards (only available in the US).
CCSSHSF-IF.C.7
Graph functions expressed symbolically and show key features of the graph, by hand in simple cases and using technology for more complicated cases.
CCSSHSF-IF.C.7e
Graph exponential and logarithmic functions, showing intercepts and end behavior, and trigonometric functions, showing period, midline, and amplitude.
CCSSHSF-BF.B.3
Identify the effect on the graph of replacing 𝘧(𝘹) by 𝘧(𝘹) + 𝘬, 𝘬 𝘧(𝘹), 𝘧(𝘬𝘹), and 𝘧(𝘹 + 𝘬) for specific values of 𝘬 (both positive and negative); find the value of 𝘬 given the graphs. Experiment with cases and illustrate an explanation of the effects on the graph using technology.
CCSSHSF-LE.A.2
Construct linear and exponential functions, including arithmetic and geometric sequences, given a graph, a description of a relationship, or two input-output pairs (include reading these from a table).
Reviews
Questions & Answers
30.3k Followers
