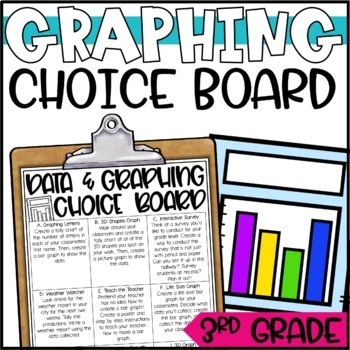
Graphing Enrichment Activities for 3rd Grade - Choice Board, Math Menu
What educators are saying
Also included in
- NO-PREP, 3rd Grade Math Enrichment Projects and Challenges - Early Finisher ActivitiesDo you want your math enrichment plans done for the YEAR?! These third grade math menus are perfect for early finishers and students who need a challenge. These activities are meaningful, challenging and engaging -Price $19.50Original Price $27.00Save $7.50
Description
NO-PREP, 3rd Grade Graphing Enrichment Projects and Challenges
This graphing choice board is full of no-prep math challenges - perfect for 3rd grade math classes that need enrichment! Give early finishers the opportunity to explore bar graphs, picture graphs and line plots in a deeper and meaningful way with this math menu! These activities are perfect for extensions for fast finishers .
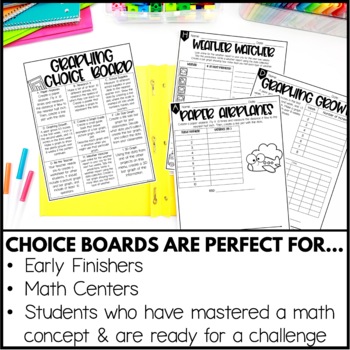
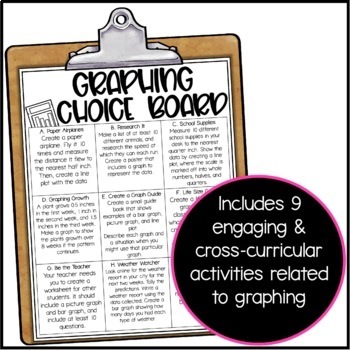
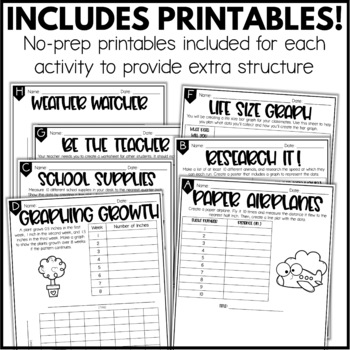
This math menu can be used as a tic-tac-toe board, and is full of 9 highly engaging and cross-curricular enrichment activities. A variety of activities are included - hands-on, writing, drawing, and so much more! To help make this a completely independent option for your students, there are printables included to accompany most activities. This provides more structure and guidance so that your small groups aren't being interrupted with questions.
Just print them as a pack at the beginning of your graphing unit, and give them to students to work on when they finish their center work. These are also great for math enrichment or gifted groups.
⭐ Save over 25% by purchasing the Math Menu BUNDLE for 3rd grade!
More Data & Graphing resources:
• Math Mission: Data & Graphing Escape Room
• Graphing Hands-On Math Center

