TPT
Total:
$0.00

Graphing Boom Cards Bundle

Rated 4.9 out of 5, based on 162 reviews
4.9 (162 ratings)
;
Second Grade Smiles
11.6k Followers
Grade Levels
2nd - 3rd, Homeschool
Resource Type
Standards
Formats Included
  • Zip
  • Internet Activities
Pages
60 Digital Task Cards
$6.00
List Price:
$7.50
You Save:
$1.50
Bundle
$6.00
List Price:
$7.50
You Save:
$1.50
Bundle
Share this resource
Report this resource to TPT
Second Grade Smiles
11.6k Followers
Compatible with Digital Devices
The Teacher-Author has indicated that this resource can be used for device-based learning.

What educators are saying

These activities are always a wonderful resource to use to check for understanding and/or independent work. Thank you!
My students love using boom cards and this resource is a great way to supplement our math curriculum. Students can practice independently or with a partner or small group.

Products in this Bundle (3)

    Bonus

    Clickable link to add all the decks to your Boom account at once!
    Also included in
    1. Includes an entire year of digital, self-checking math task cards that cover core math skills taught in second grade! It currently includes 59 Boom Card™ decks. Ideal for math centers, math warm-ups, homework, distance learning assignments, quick assessments, and more!Digital task card decks for the
      Price $90.00Original Price $158.00Save $68.00

    Description

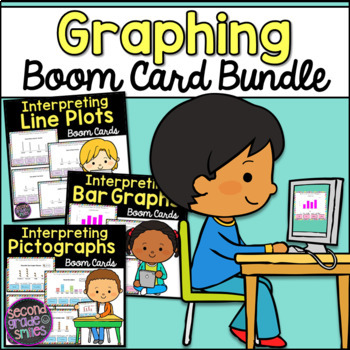
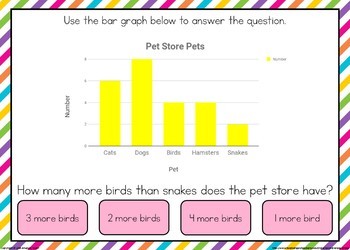
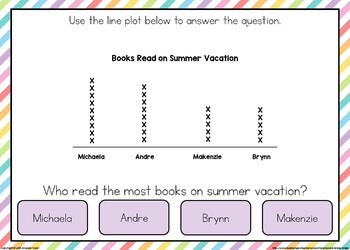
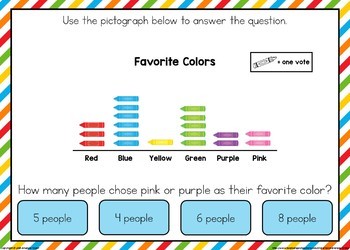
    This bundle of graphing Boom Cards™ includes three sets of digital task cards designed to help your students practice reading and interpreting bar graphs, picture graphs, and line plots.

    Assign the different decks at different points in your class's study of graphs, or assign different decks to different groups of students to differentiate their practice!

    Due to the digital nature of the cards, students receive immediate feedback and an opportunity to correct incorrect answers. As the teacher, you’ll be able to look up detailed reports on their progress!

    Click the cover images above to see video previews of each deck in action and additional sample cards from each deck!

    ►►►►►►►►►►►►►►►►►►►►►►►►►►►►►►►►►►►►►►►►►►►►►►►

    LEARN MORE about BOOM CARDS:

    To use Boom Cards, you must be connected to the Internet. Boom Cards play on modern browsers (Chrome, Safari, Firefox, and Edge). Apps are available for Android, iPads, iPhones, and Kindle Fires. For security and privacy, adults must have a Boom Learning account to use and assign Boom Cards. You will be able to assign the Boom Cards you are buying with "Fast Pins," (play provides instant feedback for self-grading Boom Cards). Fast Play is always a free way for students to engage with Boom Cards decks. For additional assignment options you'll need a premium account. If you are new to Boom Learning, you will be offered a free trial of our premium account. Read here for details: http://bit.ly/BoomTrial.

    ►►►►►►►►►►►►►►►►►►►►►►►►►►►►►►►►►►►►►►►►►►►►►►►

    If you enjoy this product, please consider following my store. New Boom Card decks will be added regularly! You can contact me with any questions or requests at secondgradesmilesstore@gmail.com.

    Thank you,

    Amanda Taylor @ Second Grade Smiles

    Total Pages
    60 Digital Task Cards
    Answer Key
    N/A
    Teaching Duration
    N/A
    Report this resource to TPT
    Reported resources will be reviewed by our team. Report this resource to let us know if this resource violates TPT’s content guidelines.

    Standards

    to see state-specific standards (only available in the US).
    Generate measurement data by measuring lengths of several objects to the nearest whole unit, or by making repeated measurements of the same object. Show the measurements by making a line plot, where the horizontal scale is marked off in whole-number units.
    Draw a picture graph and a bar graph (with single-unit scale) to represent a data set with up to four categories. Solve simple put-together, take-apart, and compare problems using information presented in a bar graph.
    Draw a scaled picture graph and a scaled bar graph to represent a data set with several categories. Solve one- and two-step “how many more” and “how many less” problems using information presented in scaled bar graphs. For example, draw a bar graph in which each square in the bar graph might represent 5 pets.
    Generate measurement data by measuring lengths using rulers marked with halves and fourths of an inch. Show the data by making a line plot, where the horizontal scale is marked off in appropriate units-whole numbers, halves, or quarters.

    Reviews

    Questions & Answers

    11.6k Followers