
Grade 7 Data Literacy NEW Ontario Math Digital Google Slides : D . Data


- PDF
- Google Apps™

What educators are saying
Also included in
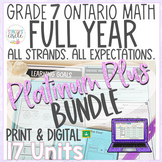 This Ontario Math Bundle includes products that cover the ENTIRE GRADE 7 NEW ONTARIO MATH CURRICULUM - EVERY expectation, all strands. It includes all of my Grade 7 Digital Slides Units PLUS all of my Comprehensive Printable Units including all editable assessments.This bundle was created after counPrice $229.00Original Price $272.00Save $43.00
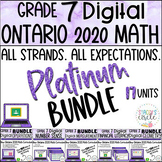 Are you teaching the Grade 7 Ontario Math Curriculum and looking for a FULL YEAR resource that has it all? This Full Year Ontario Math Curriculum Bundle from Stacey's Circle is the solution!This Digital Math Bundle includes products that cover the ENTIRE GRADE 7 NEW ONTARIO MATH CURRICULUM - EVERY ePrice $131.99Original Price $154.00Save $22.01
Description
This comprehensive digital Ontario Math resource covers EVERY single specific expectation from the D1. Data Literacy strand in the NEW Grade 7 2020 Ontario Math Curriculum-- See below for specific expectations. Grade 7 Teachers, you're going to want this in your collection!
WHY BUY THIS PRODUCT OVER OTHERS?
- My vision for teaching math is always "Don't just tell the story, let the students experience the story first hand". HOW?
- Students will be walked through curriculum concepts step-by-step in easy-to-understand language using identifiable and relatable problems.
- Rather than mostly instructional slides, this product places a heavy focus on consolidation of concepts using a large variety of interactive and engaging skill practice activities.
- Designed with differentiated learning needs in mind helping you meet all learners through multiple entry points.
~NEW AUGUST 2023 UPDATES!`
The creative component to this resource will engage your learners in ways that basic rote textbook learning simply cannot. There are hours of creative work put into each slide in addition to rich curriculum content and real-world connections. Purchased fonts, clipart, design pieces, and graphics will capture the attention of your students and help promote the highest levels of student engagement.
What You Will Get From This Download:
- A Completely hassle free unit that will guide students through the Data Strand in the NEW 2020 ONTARIO MATH CURRICULUM (D1. Data Literacy)
- Minds on Real-World activities to engage learners and spark interest
- Interactive activity slides using movable pieces and manipulatives
- Straightforward lessons that are engaging and promote critical thinking
- A complete and detailed answer key located at the end of the slides
- 111 slides including detailed answers + a Summative Google Form™ Assessment
- All embedded fonts, clipart, and graphics are LOCKED to prevent students from changing content and moving layered pieces
- Portion of slide deck is UNLOCKED to edit and for differentiation and extra skill practice
- Text boxes and drag and drop features embedded into activities and tasks to allow students to demonstrate their understanding
- All Curriculum expectations embedded into this resource for accountability
- Learning Goals located at the beginning of the unit
- Thinking Extension Question and Home Extension Activity
- Self-grading Summative Assessment
Curriculum Content Overview (ALL DATA LITERACY EXPECTATIONS)
- Percentages to represent distribution (D1.1)
- Relative frequency tables including percentages (D1.1)
- Identifying and creating circle graphs including finding unknown percentages and values (D1.1)
- Creating angles on circle graphs (D1.6)
- Identifying and collecting discrete, continuous, and qualitative data to answer questions of interest (D2.2)
- Selecting and creating appropriate graphs (D1.3)
- Infographics (NEW!) (D1.4)
- Measures of central tendency (mean, median, mode, range) and describing how outliers affect data distribution (D1.5)
- Analyze and interpret different data sets and make informed judgements, inferences, and conclusions (D1.6)
- Misleading graphs (D1.6)
__________________________________________________________________________________________
Reviews help TPT sellers and buyers. Please leave a review on this product if you enjoyed. All paid product reviews earn FREE TPT credits to use on future purchases.
__________________________________________________________________________________________
_________________________________________________________________________
Questions? info@staceyscircle.com
Instagram for freebies: @staceys.circle - I always launch products at free or promotional discounts so make sure you follow along! ❤️
