
Grade 3 Ontario Math - Data Literacy Worksheets PDF + Editable Google Slides


- Zip
- Google Apps™

What educators are saying
Also included in
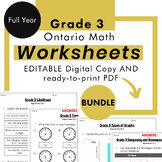 Are you planning for the NEW Grade 3 Ontario Math Curriculum? These NO PREP worksheets for extra practice is exactly what your students need!THERE IS A TOTAL OF 10 WORKSHEET PACKAGES INSIDE THIS BUNDLE for a total of 240 pages (including answers).All worksheets line up to my digital units HERE but cPrice $68.00Original Price $71.50Save $3.50
 This is a COMPLETE SOLUTION to deliver the New Grade 3 Ontario Math Curriculum.This is meant to be no-prep and ready-to-go ➡️ resources that I have used in my very own classroom. This COMPLETE SOLUTION BUNDLE includes my Digital Slides Bundle, Worksheets Bundle, and Assessments Bundle It includes allPrice $178.20Original Price $198.00Save $19.80
Description
Are you looking for practical and easy to use supplement practice for the NEW Grade 3 Ontario Math Curriculum? These ready-to-print PDF and EDITABLE worksheets is exactly what you need!
Note this resource compliments my digital Data Literacy unit, but can also be used separately! This resource contains 6 worksheets for your students to apply what they have learned in the Data strand for Data Literacy. Each worksheet specifies which Ontario Curriculum Expectation is being covered. *These worksheets do not include lessons - the purpose of this resource is to provide additional practice for students*
What’s Included:
- 6 PDF worksheets (21 pages)
- 6 EDITABLE Google Slide worksheet links
- 5 PDF Answer sheets (16 pages)
Titles of worksheets and expectations covered:
1. Sorting Data (D1.1)
2. Collecting Data (D1.2)
3. Types of Graphs (D1.3)
4. Mean and Mode (D1.4)
5. Analyzing Graphs and Drawing Conclusions (D1.5)
6. Drawing Graphs - Culminating Project
Are you looking for instructional and interactive lessons that cover all expectations in this strand? Check out this Data Literacy digital unit.
Are you looking for SUMMATIVE assessments for the New Ontario Curriculum? Check out this Data Literacy Assessment Package.
Do you want to see how I use all these resources in my own class? Click HERE.
See MY STORE for all the other worksheets! Follow my store to get all the updates!
Please note that I take great time in creating these resources. If you have any concerns I would greatly appreciate if you reach out to me through email as I strive to provide value-added resources for all my customers. You can email me at: margaret@mycalltoteach.com
Finally, follow me on Instagram, as this is where I post what I'm working on and what I launch - and I always launch with a flash sale or freebie!
_________________________________________________________________
Want to save on TPT resources? Remember to leave a review! For every review you leave, you can earn credits towards future TpT purchases. Simply go to your “My Purchases” page and click the “Provide Feedback” button.
I truly value your feedback!
Follow me to receive updates on new products.
_________________________________________________________________
Instagram * Facebook * My TPT Store * Tik Tok * YouTube * My website
