Math of the South by Kristina Caldwell
994 Followers
Resource Type
Standards
CCSS8.F.A.1
CCSS8.F.A.2
Formats Included
- PDF
Pages
2 pages
Math of the South by Kristina Caldwell
994 Followers
Description
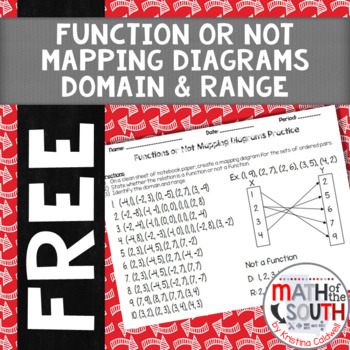
This is a practice assignment that can be used to practice creating mapping diagrams for sets of ordered pairs.
The practice directions also ask the students to identify whether the relation is a function and the domain and range.
I have included an answer key for easy grading.
I recommend shrinking the product and copying two per page for paper-saving.
The practice directions also ask the students to identify whether the relation is a function and the domain and range.
I have included an answer key for easy grading.
I recommend shrinking the product and copying two per page for paper-saving.
Total Pages
2 pages
Answer Key
Included
Teaching Duration
40 minutes
Report this resource to TPT
Reported resources will be reviewed by our team. Report this resource to let us know if this resource violates TPT’s content guidelines.
Standards
to see state-specific standards (only available in the US).
CCSS8.F.A.1
Understand that a function is a rule that assigns to each input exactly one output. The graph of a function is the set of ordered pairs consisting of an input and the corresponding output.
CCSS8.F.A.2
Compare properties of two functions each represented in a different way (algebraically, graphically, numerically in tables, or by verbal descriptions). For example, given a linear function represented by a table of values and a linear function represented by an algebraic expression, determine which function has the greater rate of change.


