TPT
Total:
$0.00

"First Day Jitters" Math and Literacy Integrated Lesson

;
Farmhouse in First
115 Followers
Grade Levels
K - 2nd, Homeschool
Subjects
Standards
Formats Included
  • Zip
Pages
9 pages
$1.00
$1.00
Share this resource
Report this resource to TPT
Farmhouse in First
115 Followers

Description

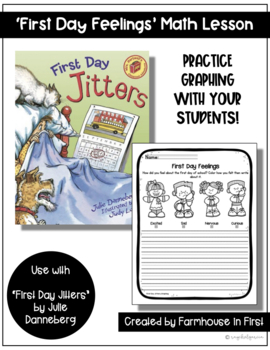
I love using the book "First Day Jitters" by Julie Danneberg on the first day of school! For students who have never read it, the twist at the end is such a fun surprise! Integrate math and literacy into one lesson using this lesson plan, complete with teacher directions, handouts, and a Smartboard Notebook Lesson for whole-group practice. This lesson has students graph their 'first day feeling' and is a great way to introduce data collection to your students, comparing numbers (greater than, less than), and can even be used to introduce addition/subtraction (ex: I notice this column has 3 students and this one has 4, how many students do they have all together (3+4=?)). This activity allows for a number of rich number talks, a great way to build number sense, and informally assess students' mathematical understanding on the very first day of school!

Included:

-Lesson Plan

-Student Handout

- Smartboard Notebook Whole Group Lesson

You will need:

- "First Day Jitters" by Julie Danneberg

-Student Coloring Supplies

-Smartboard Notebook Program on your computer

All files are copyrighted. This resource is limited to one classroom use only, please purchase additional licenses or direct your colleagues to my store to purchase, thank you!

Total Pages
9 pages
Answer Key
N/A
Teaching Duration
45 minutes
Report this resource to TPT
Reported resources will be reviewed by our team. Report this resource to let us know if this resource violates TPT’s content guidelines.

Standards

to see state-specific standards (only available in the US).
Directly compare two objects with a measurable attribute in common, to see which object has “more of”/“less of” the attribute, and describe the difference. For example, directly compare the heights of two children and describe one child as taller/shorter.
Classify objects into given categories; count the numbers of objects in each category and sort the categories by count.
Organize, represent, and interpret data with up to three categories; ask and answer questions about the total number of data points, how many in each category, and how many more or less are in one category than in another.
Draw a picture graph and a bar graph (with single-unit scale) to represent a data set with up to four categories. Solve simple put-together, take-apart, and compare problems using information presented in a bar graph.
With prompting and support, retell familiar stories, including key details.

Reviews

Questions & Answers

115 Followers