Exploring Data Representation: Grade 5 Math Worksheets
WonderTech World
14 Followers
Grade Levels
5th - 7th
Subjects
Resource Type
Formats Included
- PDF
Pages
60 pages
WonderTech World
14 Followers
Description
These grade 5 math worksheets delve into various methods of data representation, offering students opportunities to create, interpret, and analyze graphs, plots, and statistical measures.
- Double Bar Graphs: Students learn to create and analyze double bar graphs, which display two sets of data on the same graph, enabling comparisons between them.
- Double Line Graphs: These worksheets introduce double line graphs, illustrating how two data sets change over time. Students analyze continuous data trends represented by connecting data points.
- Line Plots with Fractions: Students create and interpret line plots depicting the frequency of events over a number line, with data involving fractions.
- Stem and Leaf Plots: Students learn to create, read, and analyze stem and leaf plots, decomposing data into stems and single-digit leaves for a concise visual representation.
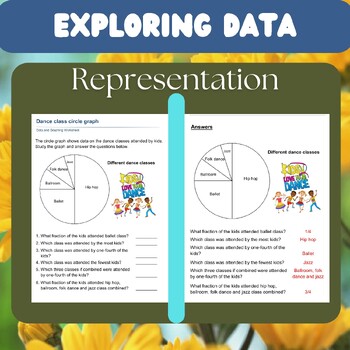
- Pie Charts with Fractions: These worksheets focus on creating and analyzing pie charts, where the size of each slice represents the frequency of a category in the overall population, labeled with fractions.
- Basic Probability: Students determine the probability of certain events and express them as fractions, developing foundational understanding of probability concepts.
- Range and Mode: Students calculate the range (difference between largest and smallest value) and mode (most frequent value) of data sets, enhancing their grasp of data distribution.
- Range, Median, and Mode: Students determine the range, median (middle value), and mode (most frequent value) of data sets, exploring various aspects of data central tendency.
- Mean or Average: Students calculate the mean or average of various data sets, reinforcing understanding of arithmetic average calculations.
- Statistical Measures: Worksheets cover mean, median, and mode as three ways of representing data sets with single numbers, providing comprehensive practice in statistical analysis.
Through these diverse worksheets, students develop essential skills in interpreting and analyzing data representations, preparing them for more advanced statistical concepts and problem-solving scenarios.
Total Pages
60 pages
Answer Key
N/A
Teaching Duration
N/A
Report this resource to TPT
Reported resources will be reviewed by our team. Report this resource to let us know if this resource violates TPT’s content guidelines.


