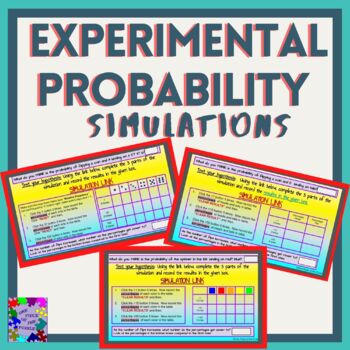
Experimental Probability Simulations
One Piece of the Puzzle
24 Followers
Grade Levels
8th - 10th
Subjects
Resource Type
Standards
CCSS7.SP.C.5
CCSS7.SP.C.6
Formats Included
- PDF
- Google Apps™
Pages
3 pages
One Piece of the Puzzle
24 Followers

Includes Google Apps™
The Teacher-Author indicated this resource includes assets from Google Workspace (e.g. docs, slides, etc.).
Also included in
- This product provides a notetaking guides for: Sample Space and Probability (Geometric Probability included) Guided NotesExperimental Probability SimulationsIndependent and Dependent Events Guided NotesMutually Exclusive and Addition Rule of Probability Guided NotesIt also includes a practice activiPrice $13.05Original Price $14.50Save $1.45
Description
The activity is to be done as an introduction to probability using online simulators to produce results of experiments in large numbers. This will allow students to see that the more times an even is repeated, the closer the experimental probability will get to its theoretical probability.
Includes 3 slides of simulations and corresponding links. Results will vary so there is no key.
This was designed to satisfy the common core standard:
CCSS.7.SP.C.5
CCSS.7.SP.C.6
Georgia Standard: MGSE7.SP.5 and MGSE7.SP.6
Total Pages
3 pages
Answer Key
N/A
Teaching Duration
30 minutes
Report this resource to TPT
Reported resources will be reviewed by our team. Report this resource to let us know if this resource violates TPT’s content guidelines.
Standards
to see state-specific standards (only available in the US).
CCSS7.SP.C.5
Understand that the probability of a chance event is a number between 0 and 1 that expresses the likelihood of the event occurring. Larger numbers indicate greater likelihood. A probability near 0 indicates an unlikely event, a probability around 1/2 indicates an event that is neither unlikely nor likely, and a probability near 1 indicates a likely event.
CCSS7.SP.C.6
Approximate the probability of a chance event by collecting data on the chance process that produces it and observing its long-run relative frequency, and predict the approximate relative frequency given the probability. For example, when rolling a number cube 600 times, predict that a 3 or 6 would be rolled roughly 200 times, but probably not exactly 200 times.


