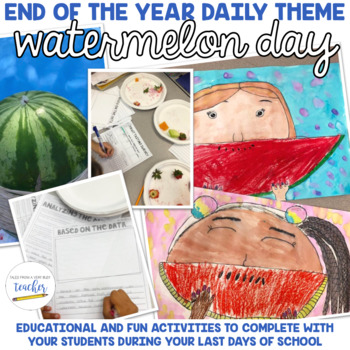
End of the Year Daily Theme: Watermelon Fun!
Tales from a Very Busy Teacher
14.2k Followers
Grade Levels
1st - 3rd
Subjects
Resource Type
Standards
CCSS1.MD.C.4
CCSS2.MD.D.10
CCSS3.MD.B.3
Formats Included
- Zip
Pages
18 pages
Tales from a Very Busy Teacher
14.2k Followers
What educators are saying
We did this the last week of school and my students went crazy when we blew up the watermelon with rubber bands! So much fun!
I loved doing this theme day at the end of the year! These activities definitely made the planning a lot easier!
Description
Engage your students with some outside play and keep it academic, too!
In this download, you'll get ideas for a whole day of fun with your students during that last week of school.
Based on third-grade CCSS measurement and data standards, these activities will help your students practice what they have already learned while having some fun with watermelon and fruit.
Students can also participate in a fun watermelon experiment that is based in third grade NGSS.
Total Pages
18 pages
Answer Key
N/A
Teaching Duration
N/A
Last updated Jun 6th, 2018
Report this resource to TPT
Reported resources will be reviewed by our team. Report this resource to let us know if this resource violates TPT’s content guidelines.
Standards
to see state-specific standards (only available in the US).
CCSS1.MD.C.4
Organize, represent, and interpret data with up to three categories; ask and answer questions about the total number of data points, how many in each category, and how many more or less are in one category than in another.
CCSS2.MD.D.10
Draw a picture graph and a bar graph (with single-unit scale) to represent a data set with up to four categories. Solve simple put-together, take-apart, and compare problems using information presented in a bar graph.
CCSS3.MD.B.3
Draw a scaled picture graph and a scaled bar graph to represent a data set with several categories. Solve one- and two-step “how many more” and “how many less” problems using information presented in scaled bar graphs. For example, draw a bar graph in which each square in the bar graph might represent 5 pets.


