TPT
Total:
$0.00

Lesson 1 PowerPoint: One Variable Data for Statistics: Dot Plots, Histograms,etc

;
Math with Ms Li
6 Followers
Grade Levels
9th - 12th, Adult Education
Standards
Formats Included
  • PPTX
Pages
22 pages
$7.00
$7.00
Share this resource
Report this resource to TPT
Math with Ms Li
6 Followers

Description

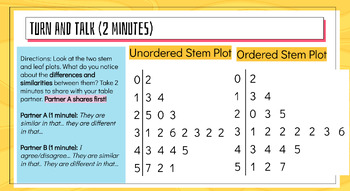
This is a lesson (on powerpoint) about statistical distributions. The lesson includes practice problems and vocabulary relating to dot plots, stem plots, and describing/comparing statistical distributions. This is for secondary math (high schoolers). It includes some data collection activities and requires students to get involved in the lesson. If you teach with a tablet, iPad, or smart board, this template is writing-friendly. You can write on the presentation or edit it as you need for your class. Warm ups are also included in the lesson.

If you teach with Stats Medic, this lesson is aligned to the first chapter in Stats Medic. The lesson covers about two 95-minute classes.

The ppt best downloaded into Google Drive and edited as you need for your class. If you teach with StatsMedic, this lesson is directly in alignment with the cadence of StatsMedic lessons and activities. Please do not make this public and/or share without permission. Thank you!

Total Pages
22 pages
Answer Key
N/A
Teaching Duration
2 days
Report this resource to TPT
Reported resources will be reviewed by our team. Report this resource to let us know if this resource violates TPT’s content guidelines.

Standards

to see state-specific standards (only available in the US).
Represent data with plots on the real number line (dot plots, histograms, and box plots).
Interpret differences in shape, center, and spread in the context of the data sets, accounting for possible effects of extreme data points (outliers).
Summarize categorical data for two categories in two-way frequency tables. Interpret relative frequencies in the context of the data (including joint, marginal, and conditional relative frequencies). Recognize possible associations and trends in the data.
Fit a function to the data; use functions fitted to data to solve problems in the context of the data.

Reviews

Questions & Answers

6 Followers