
Digital Graphing and Data Analysis with Picture Graphs


What educators are saying
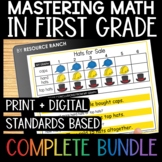
Also included in
 Are you looking to integrate more technology into your math block? Mastering Math is perfect for young students who are just getting started with digital materials. Each of these activities will give students a “hands-on” experience while they are working on their math skills – just like using maniPrice $25.50Original Price $51.00Save $25.50
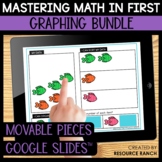 Are you looking to integrate more technology into your math block? Mastering Math is perfect for young students who are just getting started with digital materials. Each of these activities will give students a “hands-on” experience while they are working on their math skills – just like using maniPrice $6.00Original Price $8.00Save $2.00
Description
Graphing is an important math tool. This digital graphing resource will help students stay engaged while practicing graphing with three categories using colorful, movable pieces.
What is Mastering Math?
Mastering Math is a series of engaging print and digital resources developed to align with standards that often will include movable pieces. For example, in this resource students will manipulate pictures to sort, organize, and graph data.
What skills are covered with this Mastering Math resource?
There are ten thematic graphing activities which include practice for sorting, organizing, graphing, and data analysis.
How are the activities presented?
Students will work through graphing and data analysis using themed data that carries throughout a three-part process.
- Part One: students will sort and organize their data.
- Part Two: students will use data and movable pieces to create a graph.
- Part Three: students will read the graph to draw conclusions and answer questions.
What are the graphs included?
- Grandma's Buttons
- Our Favorite Treats
- School Supplies
- School Lunch
- Our Favorite Weather
- Apple Eating Contest
- The Candy Store
- Shells on the Beach
- Star Stickers
- The Pet Store
What program(s) does this resource use?
This digital center was created with Google Slides™ and can be used in your Google Classroom™.
Will you have access to my Google Drive?
No! Your download comes with links for you to make a copy of this Mastering Math resource.
I thought this was a Google resource. Why am I downloading a PDF?
The PDF includes the links to your resource.
Do I have to use all the slides?
No, just use what you need. You may find it is best to send your students one three-part graphing set at a time so they are not overwhelmed. I highly suggest creating a master copy of the original file in your Drive. Then create a copy to make any changes to (such as deleting or rearranging slides).
Do you have more resources for practicing graphing?
Yes! Digital Graphing and Data Analysis for Google Slides™ Set 2 offers ten more themed practice activities in the same format.
I love this, but my students aren't ready to work with three categories yet. Do you have anything with two categories?
You can find a similar resource with two and three categories in Creation Castle's store.
