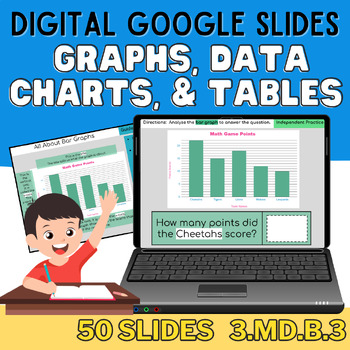
Digital 3rd Grade Measurement: Bar & Picture Graphs, Tally Charts, Data Tables
Enhance SEL
569 Followers
Grade Levels
2nd - 4th, Homeschool
Subjects
Resource Type
Standards
CCSS2.MD.D.10
CCSS3.MD.B.3
Formats Included
- Google Slides™
- Internet Activities
Pages
50 pages
Enhance SEL
569 Followers

Made for Google Drive™
This resource can be used by students on Google Drive or Google Classroom. To access this resource, you’ll need to allow TPT to add it to your Google Drive. See our FAQ and Privacy Policy for more information.
What educators are saying
My curriculum is greatly lacking in practice with graphs. This was wonderful for additional practice and required no prep.
I came in the middle of the year and had to catch my class up in math. I did have a great deal of time. The slides helped during my lessons to reinforce the textbook.
Description
Unlock the power of data interpretation and graphing skills with our highly interactive and engaging Digital 3rd Grade Graphing Unit, also suitable for 2nd, 3rd, & 4th Graders! This comprehensive resource offers a versatile array of activities to reinforce graphing concepts, featuring topics such as data tables, tally charts, picture graphs, and bar graphs.
Key Features:
- Entire resource available for preview, ensuring seamless integration into your curriculum
- Compatible with various digital platforms including Google Slides, Google Classroom, PowerPoint, and more
- Usage suggestions and ideas provided for flexible implementation in diverse learning environments
- Each topic includes guided practice, independent practice, word problem practice, side notes, and virtual posters for enhanced comprehension
- Bonus: 2 FREE SEL activities (enhance social emotional learning & life skills)
Topics Covered:
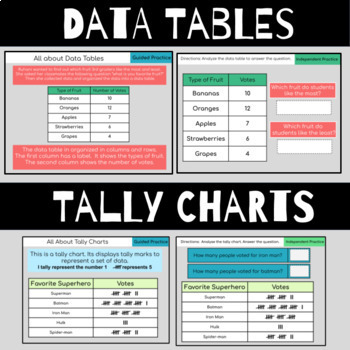
- Data Tables: Explore favorite fruits and plant growth data
- Tally Charts: Analyze favorite superhero preferences
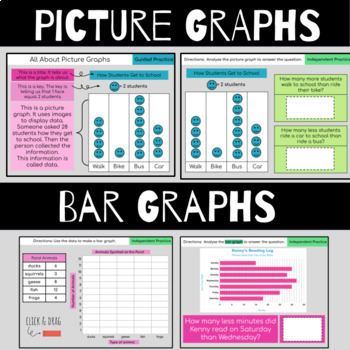
- Picture Graphs: Investigate student transportation choices
- Bar Graphs: Examine math game scores and reading habits, including opportunities to create and analyze personalized bar graphs
Empower your students to excel in graphing and data interpretation with this comprehensive digital unit, designed to foster critical thinking and analytical skills.
Click to Preview these Effective & Engaging Resources
Digital 3rd Grade Multiplication & Arrays
Digital 3rd Grade Multiplication Unit
Total Pages
50 pages
Answer Key
Does not apply
Teaching Duration
2 Weeks
Report this resource to TPT
Reported resources will be reviewed by our team. Report this resource to let us know if this resource violates TPT’s content guidelines.
Standards
to see state-specific standards (only available in the US).
CCSS2.MD.D.10
Draw a picture graph and a bar graph (with single-unit scale) to represent a data set with up to four categories. Solve simple put-together, take-apart, and compare problems using information presented in a bar graph.
CCSS3.MD.B.3
Draw a scaled picture graph and a scaled bar graph to represent a data set with several categories. Solve one- and two-step “how many more” and “how many less” problems using information presented in scaled bar graphs. For example, draw a bar graph in which each square in the bar graph might represent 5 pets.


