Data and Statistics Guided Notes Lessons BUNDLE 8th Math Pre-Algebra
- Zip
What educators are saying
Products in this Bundle (5)
Bonus
Also included in
- Are you looking for ready to go 8th grade math lessons for the entire year? Get all of these 8th grade math guided notes (93 lessons) for the lowest price in this bundle! These notes were built to align with the 8th grade math TEKS, but many lessons align to CCSS and other standards as well. Each guPrice $89.99Original Price $132.00Save $42.01
- This bundle includes all the guided notes lessons, videos and differentiated worksheets you need to have your students learn and practice Data and Statistics! Each of the 5 scatter plots (associations, construction scatterplots, making predictions with trend lines), mean absolute deviation and randoPrice $12.99Original Price $17.50Save $4.51
Description
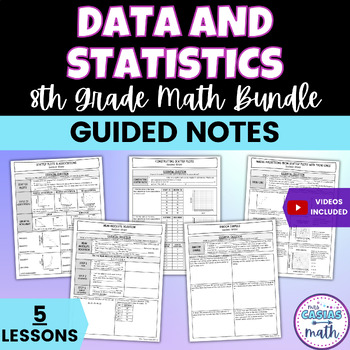
This bundle includes 5 concise, to the point and no-prep data and statistics lessons. The lessons go over the basics of scatter plots, using trend lines on a scatter plots to make predictions, mean absolute deviation, and random samples. Students and teachers love how easy these notes are to follow and understand.
This bundle includes some pre-lessons that will be necessary for students who may have missed instruction during the pandemic and need extra scaffolding. They could also work well with advanced students depending on how you use them, as they are easy to get through quickly, or could be done independently.
This guided notes bundle includes:
- Scatter Plots & Associations
- Constructing Scatter Plots
- Scatter Plots & Trend Lines
- Mean Absolute Deviation
- Random Samples
You can find the video playlist where I work out these notes on my YouTube channel here.
These notes get straight to the point of the skill being taught, which I have found is imperative for the attention span of middle schoolers! They are also a great tool for students to refer back to.
In this bundle, you can download the individual PDFs for each lesson listed out. I also include a PDF with all the bundled notes & keys in one document as a bonus.
These notes are great for in class or distance learning! They include clear instruction, key words & vocabulary, and a variety of examples. They are easy to turn into videos or interactive with google slides.
These guided notes align well with TEKS 8.5C, 8.5D, 8.11A, 8.11B, and 8.11C.
This product is included in these money-saving bundles:
☆ 8th Math Pre-Algebra Guided Notes Bundle
☆ Data & Statistics Notes + Worksheets Bundle
Related & Similar Resources:
★ Making Predictions from Scatter Plots Scavenger Hunt
★ Mean Absolute Deviation Self-Checking Sheet (+ Printable)
★ Making Predictions from Scatter Plots Self-Checking Google Sheet (+ Printable)
→ Be sure to follow my store for updates on new products >> CLICK HERE
→ Remember to leave feedback to receive TPT credits for future purchases!
→ Let’s connect! Follow me on INSTAGRAM or email me at mrscasiasmath@gmail.com ☺


