Data and Graphing Google Slides Graphing and Analyzing Data Math Lesson
- Google Drive™ folder
- Internet Activities

What educators are saying
Description
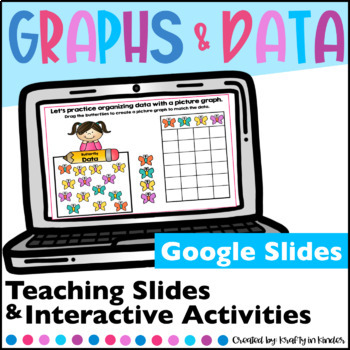
This Google Slides resource is a hands-on and interactive way to introduce and review Graphing and Analyzing Data with your students! This focuses on tally charts and picture graphs and works great for distance learning or in the classroom!
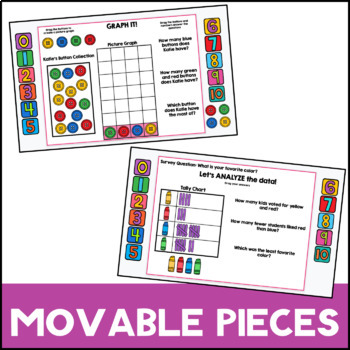
This Google Classroom resource includes teaching slides (Google Slides) as well as interactive activities with movable pieces so you can provide the most hands-on and engaging experience a digital resource can provide.
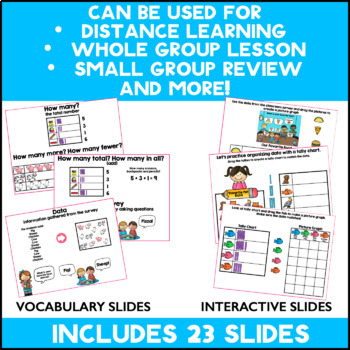
This resource includes 23 Google Slides:
- 6 slides on key vocabulary
- 2 sides that focus on organizing data
- 2 survey scenarios where students practice "collecting" and graphing data
- 2 slides that focus on making picture graphs or tally charts to match data
- 3 slides that focus on reading graphs and analyzing the data
- 3 slides that focus on organizing, graphing and analyzing data
Your students will enjoy these activities as they are able to drag movable pieces to the correct spots. You can either do this with your class as a whole group activity or assign it to them individually through Google Classroom.
Looking for more activities that focus on Graphing and Analyzing Data? Check out these Boom Cards!
Collecting, Graphing and Analyzing Data Boom Cards
-------------------------------------------------------------------------------------------------------------------------------
Terms of Use: Buying one license gives you the ability to use and send to your classroom students ONLY. If a teammate or friend is interested in this resource, you may purchase an additional license. Simply click "buy licenses to share" under the add to cart button OR find this product in your TpT purchases and click "buy additional licenses". Thank you for helping me protect my work!


