Data and Graphing | Christmas Elf Graph
- PDF
What educators are saying
Description
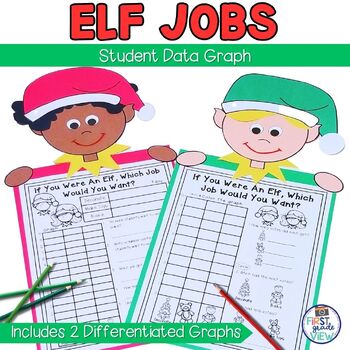
Are you looking for an engaging Christmas themed activity to help your students represent data and interpret graphs? This Christmas Elf graphing and craft activity is just what you are looking for! After polling your students about what elf job they would like to have- decorating, making toys, or baking, your students will create a class graph and engage in a math discussion that focuses on statistical analysis. Then, they will complete a bar graph on one of the differentiated recording sheets based on the data they gathered. Last, they will create a craft topper for their bar graph. This activity is aligned to the CCSS.
This product includes:
- Suggested use in the classroom
- Anchor chart ideas for math discussion (actual anchor charts are not included)
- Chart pieces to make a class graph (comes in color and black and white)
- Student response pieces
- 3 Differentiated versions of the student bar graph recording sheets
- Discussion questions/ task cards: use these questions to elicit meaningful math talk that focuses on analyzing and interpreting the data
- Printables to create a graph art topper
- Writing extension activity with 3 lined paper options
Please note: This is a print and go resource.
You won’t be disappointed in the level of engagement from your students and the ease of use with this product!
You may also be interested in:
Happy Birthday Book-Class Activity
Daily Agenda Google Slides™- Set 1
I hope you enjoy this product! Please don't forget to leave feedback. I really appreciate it! Remember, feedback earns you points that can be used towards FREE TpT purchases! Also, FOLLOW ME to be notified when new products are added.
Thank you so much,
Andrea from First Grade View


