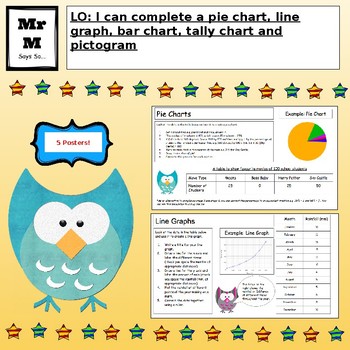
Data Handling: Line Graph, Bar Chart, Pictogram, Tally Chart and Pie Chart
- Zip
Description
This resource contains a set of five posters explaining how to create a line graph, bar chart, pictogram, tally chart and pie chart. It was created for a Grade 4 class and can also be used as a worksheet for a lesson where the students will need to gather data and complete the instructions on the sheet to create the choice of graph.
Not what your looking for? Please check out my Math Bundles below. SAVE by buying a bulk set of worksheets for under $5!
*** Bundle: Addition, Subtraction, Multiplication and Division Word Problems ***
*** Bundle: Addition and Subtraction (Number Line, Partitioning & Column Method) ***
****************************************************************************************************************
General Math Worksheet Notes:
Next to the learning objective there is a colour in brackets. The colour refers to which worksheet would be most suitable for which differentiated group. The colours below represent the following ability.
★ Red - Lower Ability
★ Orange - Middle Ability
★ Green - High Ability
I use the apple at the top right hand side of the sheet for pupil self evaluation. I get the students to colour the apple in the following colours:
★ Red - I don’t understand (please help me)
★ Orange - I am okay but need more practice
★ Green - I have met the objective and am ready for another challenge
This helps me to identify which students will need help during the next lesson, ensuring I look through their work carefully to work out what misconceptions they may be having.
****************************************************************************************************************
Comments, suggestions, feedback and questions always welcomed!
****************************************************************************************************************
♦ Be sure to click on the green ★ to follow me for updates and new product announcements!
♦ Do you need some fresh ideas and tips? Then visit MY BLOG
♦ Each time you give feedback, TPT gives you feedback credits that you use to lower the cost of your future purchases. I value your feedback greatly!
♦ If you have any questions or concerns, go ahead and contact me through the Q & A and I’ll get back to you ASAP!


