
Data Displays - Teaching PowerPoint Presentation


- Zip
Also included in
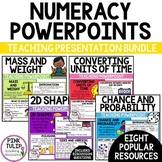 Math PowerPoint Presentations BundleThis bundle includes eight curriculum-aligned PowerPoints to guide explicit teaching of numeracy in the classroom, as listed below.Odd and Even Numbers - Teaching PowerPoint PresentationCurriculum-aligned PowerPoint presentation to guide explicit teaching of odd aPrice $23.48Original Price $29.35Save $5.87
Description
Data Displays - Teaching PowerPoint Presentation
Curriculum aligned PowerPoint presentation to guide explicit teaching of graphing and data displays.
Includes:
- Learning intention.
- Introduction (tune in).
- Engaging graphics.
- Detailed explanations of the common graphs and charts and their features.
- Interpreting information in various data displays.
- Discussion questions with answers.
- Reflection slides.
- Glossary.
Includes Google Slides access.
________________________________________
For more numeracy PowerPoints, click the links below:
Odd and Even Numbers - Teaching PowerPoint Presentation
Converting Between Units of Time - Teaching PowerPoint Presentation
Define, Compare & Describe 2D Shapes - Teaching PowerPoint Presentation
Comparing and Classifying Angles - Teaching PowerPoint Presentation
Chance and Probability - Teaching Presentation
Define, Describe & Compare 3D Shapes - Teaching PowerPoint Presentation
Mass, Weight and Volume - Teaching PowerPoint Presentation
________________________________________
For more numeracy resources, click the links below:
Open An Ice Cream Shop - Graphing and Data Math Activity
Worded Maths Problems - 4 Processes, Perimeter and Area, Time Worksheets
Place Value Into The Millions - Worksheet Pack
Open a Store Numeracy Assignment - Decimals, Percentages & Operations
Open A Cupcake Store - Cross Curriculum Project
Math PowerPoint Presentations Bundle
Multiplication Times Table Worksheets
Furnish a Home Maths Assignment - Budgeting & Basic Operations
No Prep Early Finisher Worksheet Pack - Great for Substitute Teachers
Missing Number Addition Worksheets - Mental Maths or Early Finisher
________________________________________
Follow Me
Click the green star at the top of my page to be the first to receive updates about new products and discounts.
________________________________________
Feedback
Please help me to improve my products by leaving valuable feedback. Simply click the 'Provide Feedback' button on your purchases page and leave a rating and a comment. You will also gain credits to use for further purchases.
________________________________________
Copyright Information
This product is not for commercial use, individual use only. If you plan to share this product with others, please purchase extra licenses at the 50% discounted rate.
The fonts used in my resources are from:
and
The clip art used in my resources is from:
and
________________________________________
numeracy | math | curriculum | task card | guided teaching | classroom | fractions | worded questions | data displays | shared learning | no prep | math activities | homework | calculate | tally | pie chart | line graph | column graph | dot plot | learning tool | elementary school | learning | primary school | homeschooling | homeschool
