DIGITAL Data & Graphs - Google Slides - Seesaw - with AUDIO!

What educators are saying
Also included in
- This is a collection of all the Math digital learning tools I created for the spring semester if virtual learning! Every skill has interactive activities with moveable parts (in both Google Slides and Seesaw!) to keep our primary learners learning as "hands on" as possible in this new, digital worlPrice $24.99Original Price $45.00Save $20.01
- I've bundled all my current AND FUTURE 1st Grade Math resources into one MEGA MATH BUNDLE!Includes all DIGITAL and interactive resources (accessible using Google Slides & Seesaw), printable activities, and QR code hunts! This is a GROWING BUNDLE. Purchasing a Growing Bundle means future math rePrice $139.00Original Price $264.00Save $125.00
Description
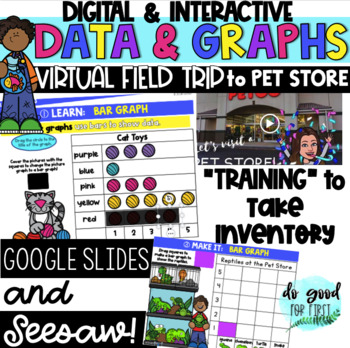
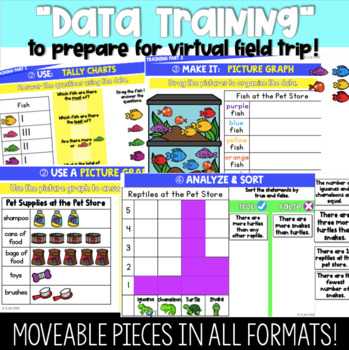
Engage your students to learning how to collect, organize & analyze data by going to "data training" before going on a virtual field trip to a pet store! Students learn how to use, make and interpret tally charts, picture graphs and bar graphs before helping out the pet store employees and "taking inventory" during their virtual tour.
All activities (PowerPoint, Google Slides, Seesaw) come with moveable pieces, AUDIO directions and embedded videos to provide the most hands on and engaging experience a digital resource can provide!
Included:
-PowerPoint file (36 slides) - Great to use for presentation!
-Google Slides - One link to entire resource or 5 links to individual lessons. The links can be shared with students (without fear of editing the same version) and shared on Google Classroom!
- 5 Preloaded Seesaw activities with moveable parts! To access, you simply click the links given and add to your activities library! See preview for specific activities.
- So many YouTube links to help with understanding data collection & graphs!
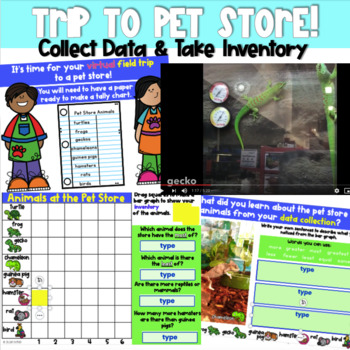
- YouTube Virtual Field Trip video to the Pet Store - I created just for this resource! Animals are labeled and easy to count for you students to "collect the data"!
>> See it all in the PREVIEW!
Interactive & Digital Data & Graphing Activities:
- Introduction to Data- 3 engaging teaching slides to set the purpose of learning how to record and organize data & motivate with a future virtual field trip to take inventory at a pet store!
- 2 videos to introduce organizing data
- Sort pictures by organized data and unorganized data
Tally Charts
- 1) Introduce/Learn- video & demonstration slide with visuals (practice drawing tallies in Seesaw lesson)
- 2) Use: Answer questions by reading tally chart and dragging and dropping the appropriate objects (fish) to answer questions.
- 3) Make: Drag and drop tally marks to show the data of the different fish at the pet store.
- 4) Analyze: Use tally chart made to think what the data means for the pet store owner (what fish needs to be reordered, which fish didn't sell, etc.).
Picture Graphs
- 1) Introduce/Learn- two videos & demonstration slide with visuals
- 2) Use: Text boxes given to answer questions by reading picture graph.
- 3) Make: Drag and drop fish on picture graph to show the inventory in the aquariums.
- 4) Move Data to a Picture Graph: Drag and drop pictures to transfer information on tally chart to a picture graph.
- 5) Analyze: 2 slides to fill in blanks or answer questions about the data shown on graph.
Bar Graphs
- 1) Introduce/Learn- 2 videos & demonstration slide. Students drag and drop squares over the pictures to turn a picture graph into a bar graph.
- 2) Use: Using the graph created on the first slide, students use data to answer questions (text boxes given).
- 3) Make It: Drag and drop squares to show the data of the different reptiles at the pet store on a bar graph.
- 4) Analyze & Sort: Referring to reptile bar graph made, statements by true or false.
- 5) Make Your Own Conclusions: Students use bar graph, word bank and text boxes to write their own statements about what they notice from the data.
Virtual Field Trip & Real Life Data Collection!
- 1) YouTube virtual field trip video - created just for this resource! Animals are labeled and easy to count. Students take inventory using a tally chart of the animals they see in during the virtual tour! Visual directions on how to set up their own paper to tally as they "tour".
- 2) Transfer the data from a tally chart to a bar graph by dragging and dropping squares. Vibrant clip art use to represent the animals seen in the video. :)
- 3) Make Your Own Conclusions: Students use their bar graph, word bank and text boxes to write their own statements about what they notice from the data.
Make Your Own Pet Rescue!
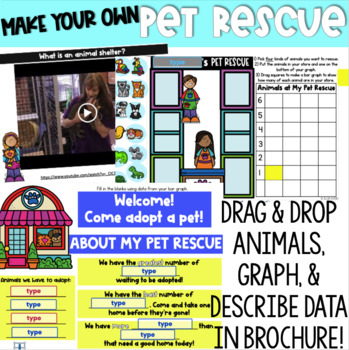
- Two videos explaining what an animal shelter is, how it differs from a pet store and what a day in the life of an animal shelter worker looks like!
- Students create their own pet rescue! Choose four (out of 11 options) animals to have in their rescue. Drag movable animal images into their store!
- Create a bar graph to show how many of each type of animal they have. Drag and drop squares to graph the data.
- Make a Brochure: Students use the data from their bar graph & fill in the blanks to tell people all about the animals they have in their rescue. Text boxes given!*
★★ Terms of Use for Digital Resources: Buying one license gives you the ability to use and send for your classroom students ONLY. If you have a teammate or friend interested in this resource, it's your responsibility to offer for them to use your 50% discount to buy them an additional license. Simply click "buy licenses to share" under the add to cart button OR find this product in your TpT purchases and click "buy additional licenses". Sincerely, thank you for helping me protect my work!
★ Let's connect! Follow me on social media media for ideas, sales and new product alerts!
Do Good for First Facebook ★ Join my email list for freebies! Click here for blog and enter email address in pop box!

