Description
Class Data Display | Bar Graphs, Tallies, Pictographs:
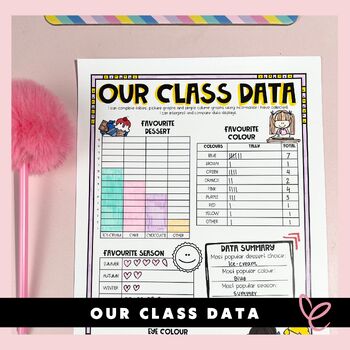
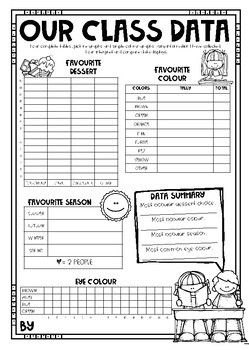
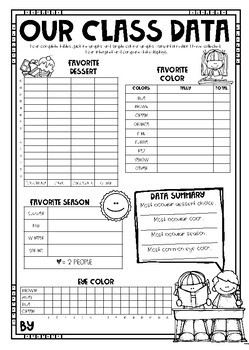
Enhance data literacy skills with our Class Data Display poster! This interactive poster allows students to collect and display information about their class, including favorite seasons, desserts, colors, and eye colors. With two versions available - AUS and UK/US spellings - students can practice using different spellings while learning about data representation.
Check out these other fun resources:
Place Value House | Craftivity
Multiplication Book | Revision
Math About Me | First Day Activity
The poster includes bar graphs (horizontal and vertical), pictographs, and tallies, providing a comprehensive review of data display methods. Engage your students in a fun and interactive way of learning about data with our Class Data Display poster!
Let’s stay in touch!
Follow me for freebies, inspiration, resources and lots of other good stuff, too.
Think of it like a little love note + cheat sheet all in one, from one teacher to another.
Additional Information
Please note, this is a downloadable, digital file that you can access immediately after purchase.To open the files you will be required to have a PDF Reader such as Adobe Acrobat Reader installed on your computer.
To edit: If the product description stipulates that the file is editable, it will be editable only in Adobe Acrobat (free). You will need to have access to Adobe Acrobat to be able to type in your text. Grab Adobe here.
‘Editable’ refers to the *text* within the file being customisable. Images and colour palettes are not editable. Simply type into the text boxes provided or add in your own to edit.
Experiencing a technical problem?
If you’re having trouble downloading or opening this file, no worries! Please make sure to read the instructions that come with this product before reaching out for assistance.
If you’re still having technical difficulties, please feel free to check out the Teachers Pay Teachers FAQ section for any other troubleshooting tips. And if you still need help, you can always reach out to support@teacherspayteachers.com and they’ll be happy to assist you. Don’t hesitate to let us know if there’s anything else we can do to help!
Terms of Use
When you purchase this resource, you have the right to make limited copies of the pages for your own single classroom or homeschool use only.
However, it’s important to note that duplicating this resource for a friend, colleague, or anyone else, or for any commercial purposes, is not allowed unless an additional license is purchased.
Please also keep in mind that copying any part of this resource and sharing it on the internet in any form, including personal or classroom websites or school servers, is a violation. We appreciate your understanding and cooperation in respecting our work and intellectual property.
Come Say Hello!
Mrs Edgar
www.mrsedgar.com.au
Blog | Facebook | Pinterest | Instagram |TikTok
Follow me
Class data display | Bar graphs | Tallies | Pictographs | Data representation | Favorite seasons | Favorite desserts | Favorite colors | Eye colors | AUS spelling | UK/US spelling | Data literacy skills | Interactive poster | Data display methods | Classroom data activity


