TPT
Total:
$0.00

Circus Cat Math Graphing Activity

Rated 4.94 out of 5, based on 17 reviews
4.9 (17 ratings)
;
Herding Kats in Kindergarten
9.7k Followers
Grade Levels
K - 1st
Resource Type
Standards
Formats Included
  • PDF
Pages
7 pages
$1.50
$1.50
Share this resource
Report this resource to TPT
Herding Kats in Kindergarten
9.7k Followers

Description

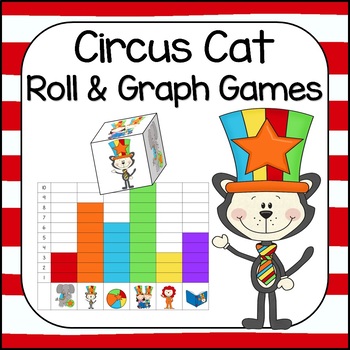
Looking for a fun March math center? These Circus Cat images make graphing fun! Your students will love rolling the cube and graphing the images and won't even realize they're learning about data analysis! This is a great independent math activity or a fun partner game. The data changes every time the game is played, so students have unlimited opportunities to practice data collection and analysis!


Included:
Circus Cat Dice Template - simply print, cut and tape. Alternate versions are available if you'd prefer to use wooden cubes or a picture cube.
Graph: students graph each roll of the dice, getting practice with collecting data! Color & b&w options included.
Comparison Sheet: students answer questions about more than, less than and equal too. Color & b&w options included.
Addition Sheet: students use their graph to create addition sentences. Color & b&w options included.

You Might Also Like:

March Sensory Bin Activities

Circus Cat Roll & Graph Activity

Circus Cat Themed Roll & Cover Addition & Subtraction Games!

Circus Cat True/False Equations

Circus Cat Word Family Game

Fishy Fry Phrases with the Circus Cat

Total Pages
7 pages
Answer Key
N/A
Teaching Duration
N/A
Report this resource to TPT
Reported resources will be reviewed by our team. Report this resource to let us know if this resource violates TPT’s content guidelines.

Standards

to see state-specific standards (only available in the US).
Directly compare two objects with a measurable attribute in common, to see which object has “more of”/“less of” the attribute, and describe the difference. For example, directly compare the heights of two children and describe one child as taller/shorter.
Organize, represent, and interpret data with up to three categories; ask and answer questions about the total number of data points, how many in each category, and how many more or less are in one category than in another.
Fluently add and subtract within 5.
Add and subtract within 20, demonstrating fluency for addition and subtraction within 10. Use strategies such as counting on; making ten (e.g., 8 + 6 = 8 + 2 + 4 = 10 + 4 = 14); decomposing a number leading to a ten (e.g., 13 - 4 = 13 - 3 - 1 = 10 - 1 = 9); using the relationship between addition and subtraction (e.g., knowing that 8 + 4 = 12, one knows 12 - 8 = 4); and creating equivalent but easier or known sums (e.g., adding 6 + 7 by creating the known equivalent 6 + 6 + 1 = 12 + 1 = 13).

Reviews

Questions & Answers