
Charts and Graphs Clip Art, Math Clipart


- Zip
Also included in
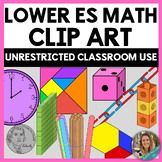 Are you sick of searching for math clipart and then worrying about whether or not you are even allowed to use it in your classroom resources? This incredibly large download includes ALL of the math clip art you will ever need in a lower elementary classroom (grades K-2). From base ten blocks to counPrice $36.40Original Price $45.50Save $9.10
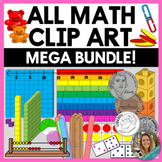 Are you sick of searching for math clipart and then worrying about whether or not you are even allowed to use it in your classroom resources? This incredibly large download includes ALL of the math clip art you will ever need. From base ten blocks to counting bears to US coins, this bundle has it alPrice $41.20Original Price $51.50Save $10.30
Description
This charts and graphs clip art set is a perfect addition to your math clip art collection! The download includes 19 .png files. Use the clip art in the following ways:
- Demonstrate how the charts and graphs are used by showing your class the premade examples
- Use the partially finished charts and graphs to change out the information but not have to change the images.
- Use the black chart and graph templates to completely customize the information to fit your needs
The following types of charts and graphs are included:
- Horizontal Bar Graph
- Vertical Bar Graph
- Line Graph
- Pie Chart
- Pictograph
- Tally Chart
- Number Chart
- Line Plot
-----
Please read my Clip Art Terms of Use before purchasing. Also read the special conditions described below to determine if additional licenses are necessary for your use of the product.
Terms of Use for Teachers and Classroom Use:
- Because I am aware that math manipulatives are needed in the virtual learning setting, math manipulative clip art is unrestricted to teachers.
- It may be distributed to one class of students. Additional licenses may be purchased if you would like to share it among more than one class of students.
- No need to purchase my moveable pieces extended license and no need to to flatten or save it as a PDF.
Terms of Commercial Use for Sellers:
- To ensure protection of my product, make sure the images are flattened and/or protected in your resources.
- This clipart can only be used in educational products. You may not resell the images as is.
Terms of Commercial Use for Sellers of Moveable Pieces:
- My Moveable Pieces Extended License must be purchased if you would like to use this clipart on the following platforms and sell on TpT or other platforms as moveable pieces.
- Google Slides/ Google Drive
- SmartBoard Software
- PowerPoint/ Keynote
- Microsoft One-Drive
- You DO NOT need the Moveable Pieces Extended License for commercial or personal use on the following secured platforms:
- Boom Cards
- SeeSaw
- If clipart is flattened in the background, you do not need to purchase the extended license.
-----
Don't forget to rate! You get TpT Credits for every $ you spend on TpT for rating and leaving feedback! If you have any questions, please ask before leaving feedback.
-----
Follow me on TpT! All items are discounted 50% in the first 48 hours of release!
Follow me on Twitter for thoughts, updates, and educational content @Mis_McCracken
